Since conquering 61,000 on the BSE Sensex and 18,200 on the Nifty 50 earlier this November, both the key benchmark indices seem to be facing relentless challenges to rally further. On Friday, the BSE Sensex declined 150 points or 0.24 per cent to 61,600 level, while Nifty 50 lost 53 points or 0.27 per cent to trade at 18,290 in early deals.
On a broader time-frame, domestic markets suffered a downward spiral in the first half of the calendar year as the key benchmark indices hit 52-weeks low in June 2022 on geopolitical concerns, central bank fostering interest rates, and currency depreciation.
The key benchmark indices, however, fought back, and were curently close to their all-time highs, falling shy of just 2 per cent; whereas the Nifty Bank has successfully claimed record peaks since September this year.
The BSE Sensex and Nifty 50 have registered a new life-time in the each of the last five calendar years, and are now yet again of verge to continuing the record-breaking streak for the sixth year. Will they succeed or will the trend be broken?
Here’s what the charts have to tell:-
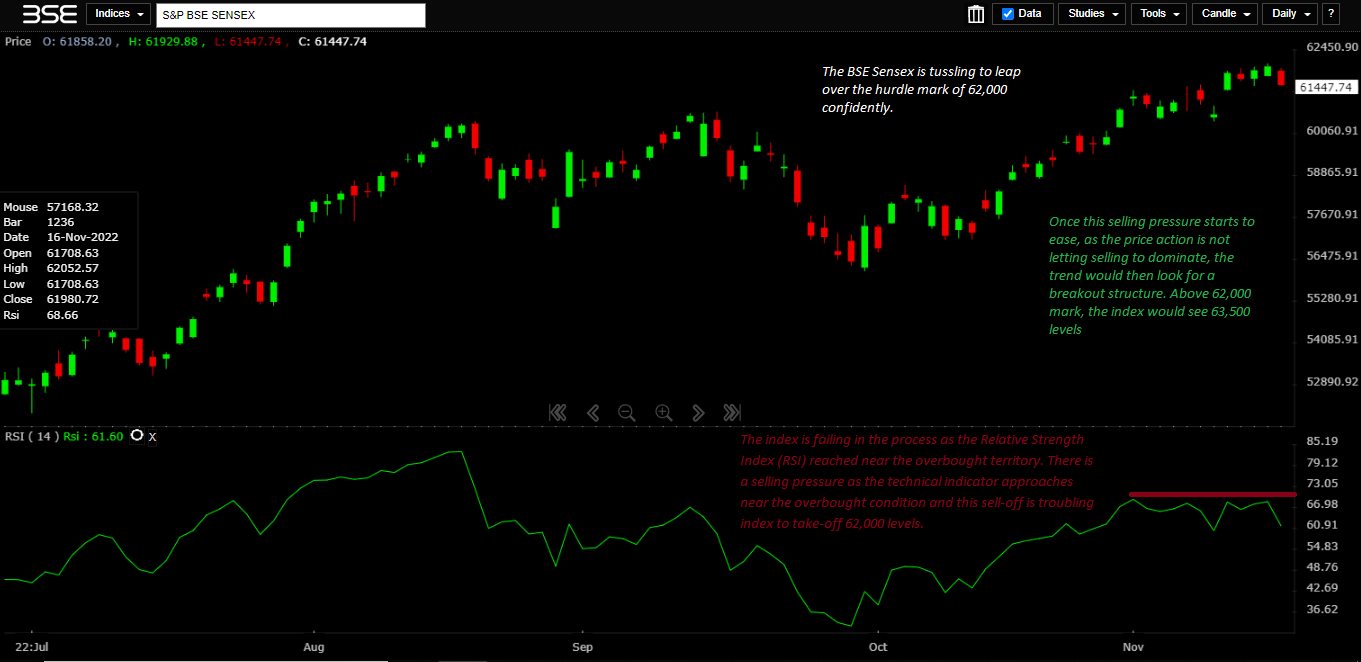
Outlook: Above 62,000 mark, the index would see 63,500
The BSE Sensex is tussling to leap over the hurdle mark of 62,000 confidently. The index is failing in the process as the Relative Strength Index (RSI) has reached near its overbought territory. There is a selling pressure as the technical indicator approaches near the overbought condition, and this sell-off is troubling index to take-off the 62,000 level.
Once this selling pressure starts to ease, as the price action is not letting selling dominate it, the trend would then look for a breakout structure. Above the 62,000-level, the index can rally to 63,500 level with support residing at 61,000, shows the daily chart.
CLICK HERE FOR THE CHART Outlook: Once 18,500 is taken-off, index to hit 19,000
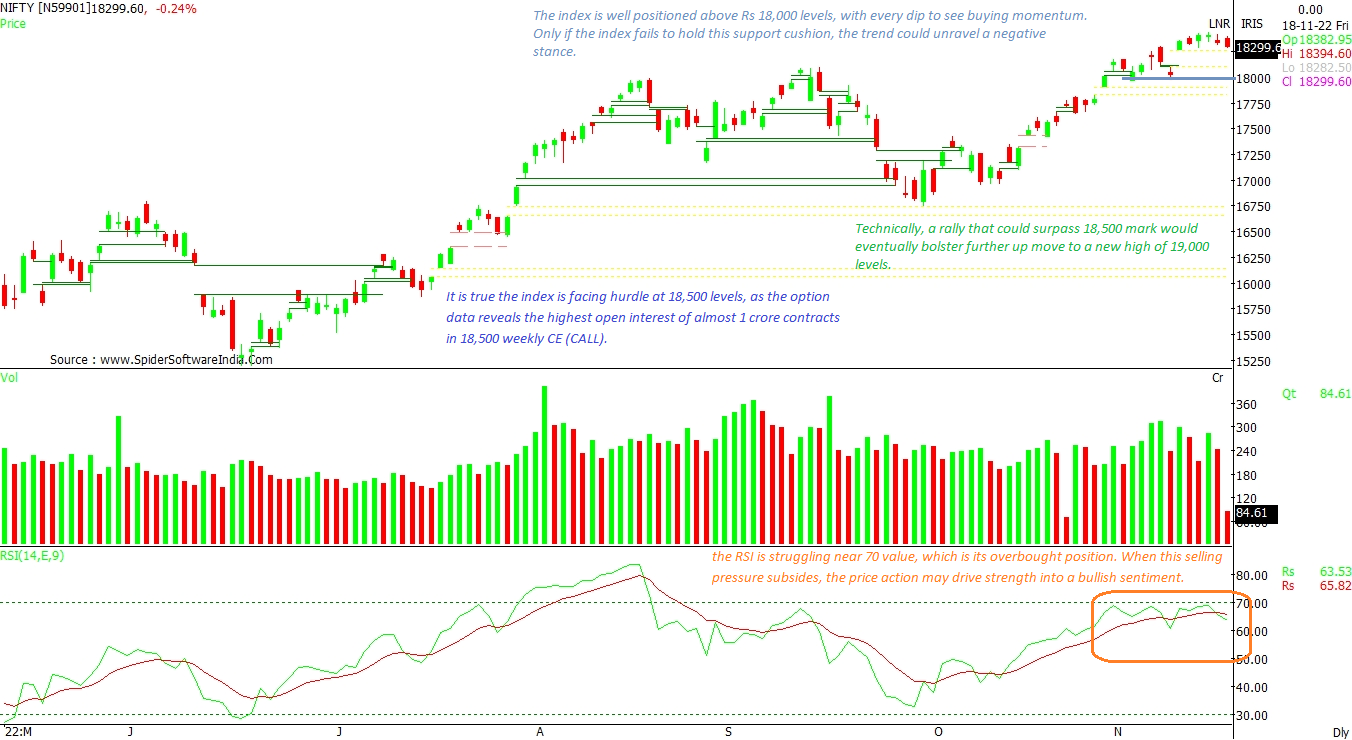
The index is well positioned above the 18,000-mark, with every dip getting absorbed owing to buying momentum. Only if the index fails to hold this support cushion, the trend could unravel a negative stance. For now, the index seems to be facing hurdle at 18,500, as the option data reveals the highest open interest of almost 1 crore contracts at the 18,500 CE (CALL).
Technically, a rally that could surpass 18,500 would eventually bolster further up move to a new high of 19,000. At this juncture, the Relative Strength Index (RSI) is struggling near 70 value, which is its overbought position. When this selling pressure subsides, the price action may drive strength into a bullish sentiment.
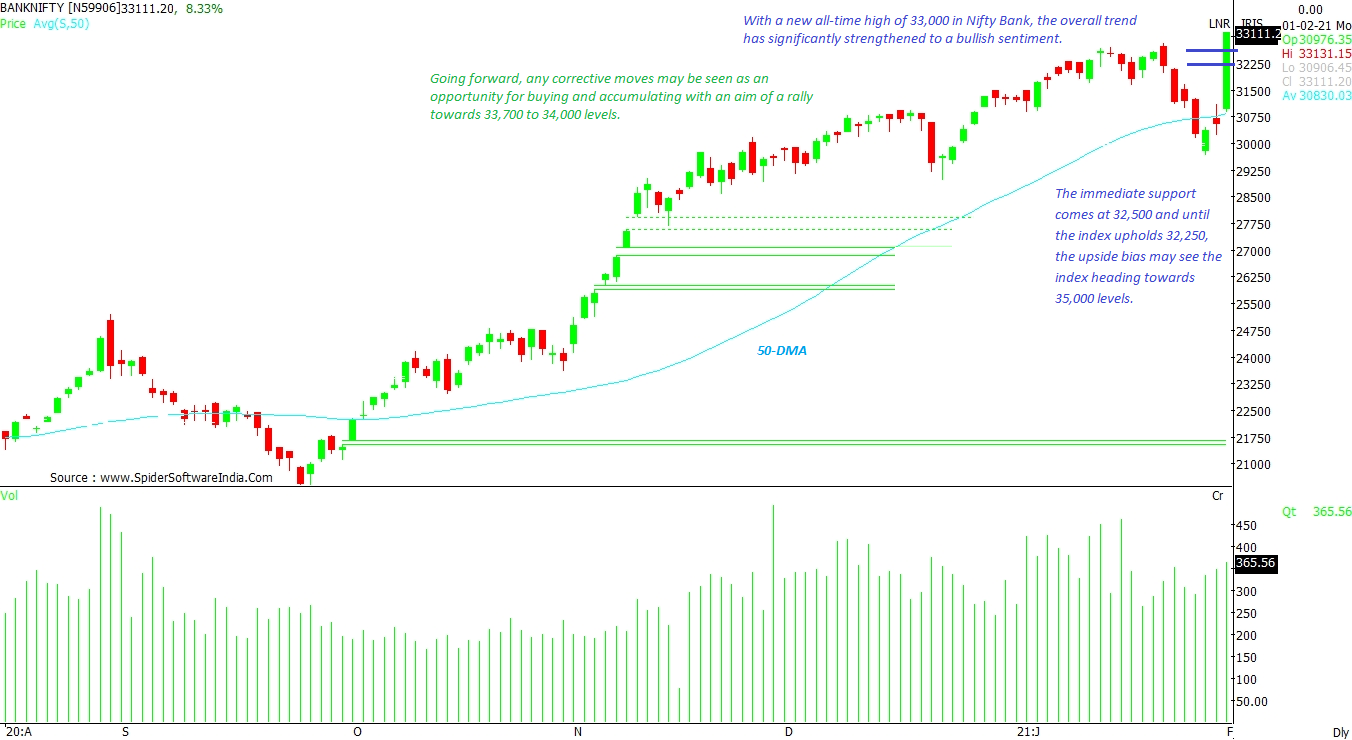
CLICK HERE FOR THE CHART Outlook: Trend is optimistic
While the overall positive trend is flourishing for the Nifty Bank index, the RSI indicator suggests a minor slowdown near 42,500-42,700 levels. The RSI has neared the 70 value which is considered as the overbought territory, hence some selling pressure is expected.
 "As Sensex struggles at 62,000, Nifty at 18,500, here's what can happen next")


