Home / Markets / News / Bajaj Fin, Bharti Airtel, ICICI Bank: How these Sensex stocks fared in 2019
Bajaj Fin, Bharti Airtel, ICICI Bank: How these Sensex stocks fared in 2019
Golden Cross is defined as an indicator of a major rally. It is essentially a crossover of short-term moving average with the long-term moving average.
The benchmark S&P BSE Sensex advanced 14 per cent in CY19, while the Nifty50 and Nifty Bank indices added 12 and 18 per cent, respectively. However, the broader market underperformed thus giving a negative return for the second straight year.
Here's a look at how top three Sensex gainers of 2019 looked on charts -
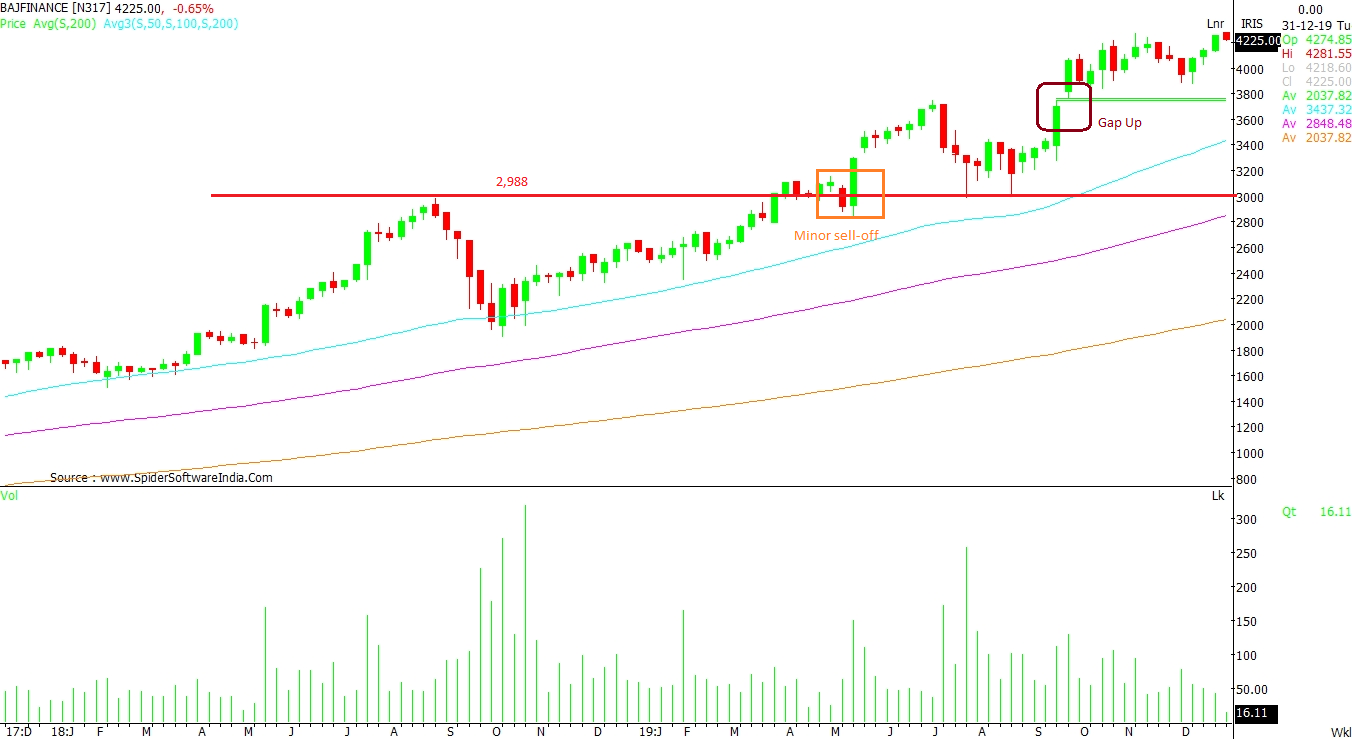
Bajaj Finance Ltd (BAJFINANCE): The level of Rs 2,988, which was the high in 2018, became the most crucial level in 2019. The moment this level was crossed, it did witness minor sell off; however, thereafter this level was never seen. The counter crossed a milestone by hitting Rs 4,200, a rise of 40 per cent in merely six months. Around this level, one can see a Gap Up close in the range of Rs 3,750- Rs 3,763.90 levels on the weekly scale. CLICK HERE FOR THE CHART
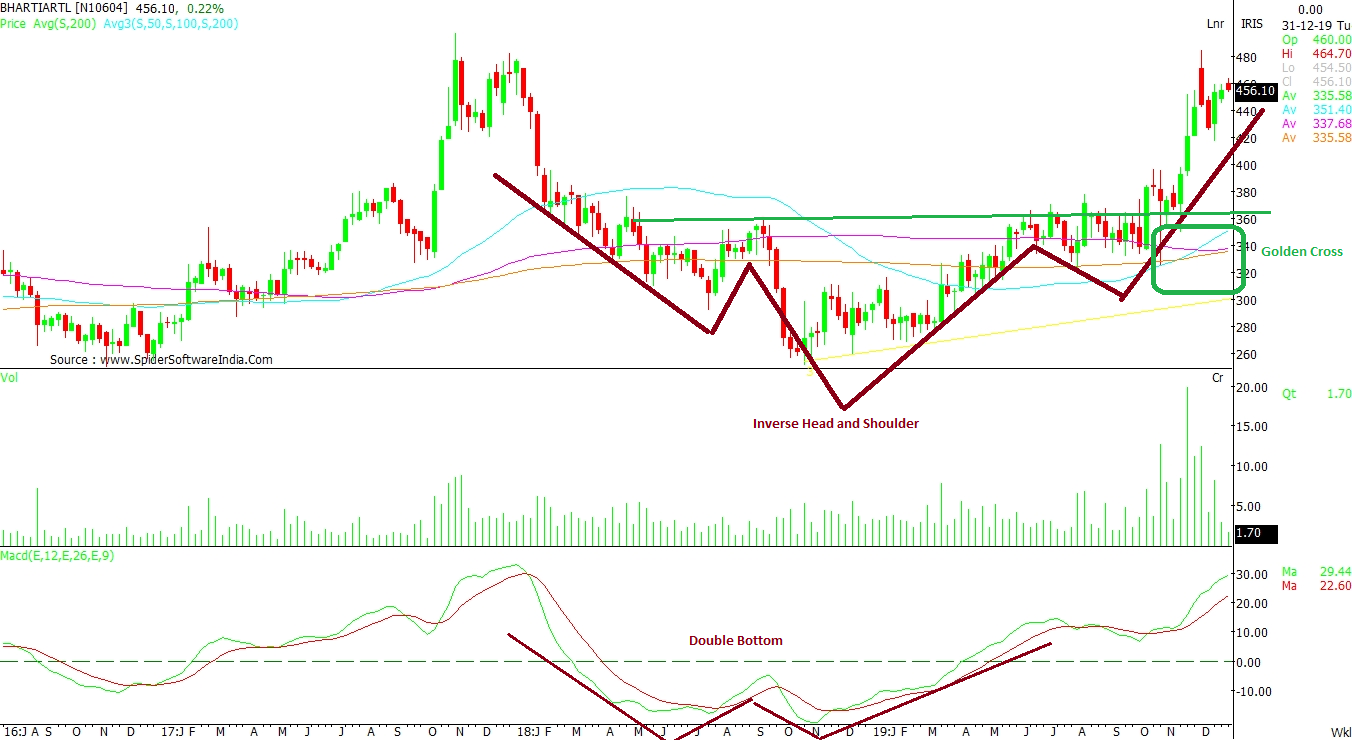
Bharti Airtel Ltd (BHARTIARTL): The formation of “Inverse Head and Shoulder” pattern resulted in a jump towards Rs 480 levels, as per the weekly chart. During the same phase, the Moving Average Convergence Divergence (MACD) had a double bottom formation. There was a Golden Cross of 50-day moving average (DMA) with 100 DMA and 200 DMA on the weekly chart. CLICK HERE FOR THE CHART
Inverse Head and Shoulder is a technical indicator which is used to predict reversals in a downtrend. Usually, it involves two highs which the counter retests and sees correction. Among the three lows, one of the lows is below the rest two. The counter sees a breakout on the third attempt visualising the upside.
Moving Average Convergence Divergence (MACD) is an indicator that shows relationship with two moving averages called the MACD line. Then a nine-day EMA is plotted on the MACD which normally serves as a trigger for buy and sell.
Golden Cross is defined as an indicator of a major rally. It is essentially a crossover of short-term moving average crosses with the long-term moving average.
Double bottom is a formation that resembles “W” structure and says about the counter making two lower bottoms before breaking out.
ICICI Bank Ltd (ICICIBANK): This counter only once closed below the 200-DMA in the entire year. Likewise, the Relative Strength Index (RSI) witnessed a dip in the oversold region at the beginning of the year and that too was for only one session. CLICK HERE FOR THE CHART
RSI is a momentum indicator that determines the overbought and oversold conditions by measuring the magnitude of recent price changes. Developed by J Welles Wilder Jr, RSI shows that a stock is overbought when it breaches 70 value on a reading scale of 0 to 100 while it becomes oversold when it slips below 30 value. Overbought condition speaks about trend reversal or correction, whereas oversold region suggests undervalued price.
 "Bajaj Fin, Bharti Airtel, ICICI Bank: How these Sensex stocks fared in 2019")


