In that backdrop, here's how the main indexes look on technical charts
S&P BSE SENSEX: The medium-term trend is bullish till the index defends 44,000 levels. Although, the Relative Strength Index (RSI) showed some weakness in the overbought condition, the index is not showing exaggerated weakness that might get carried forward. One can expect profit booking at higher levels of 46,000 ahead. That said, the overall trend seems to possess bullish sentiment and any minor dip is expected to see buying momentum.
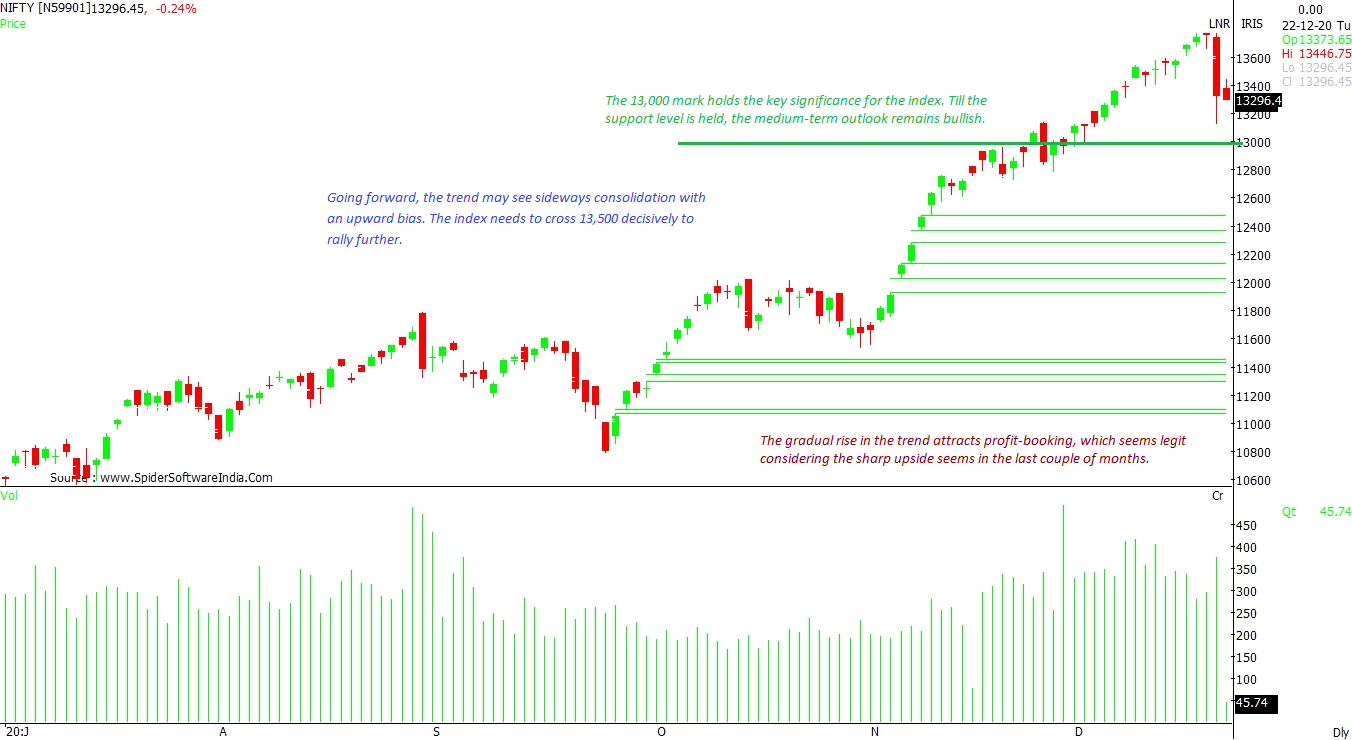
CLICK HERE FOR THE CHART NIFTY50: The 13,000-mark holds the key for the Nifty50 index. Until the time this support level is held, the medium-term outlook remains bullish. The gradual rise in the trend attracts profit-booking, which seems legit considering the sharp upside seen in the last couple of months. Going forward, the trend may see sideways consolidation with an upward bias. The index needs to cross 13,500 decisively to rally further.
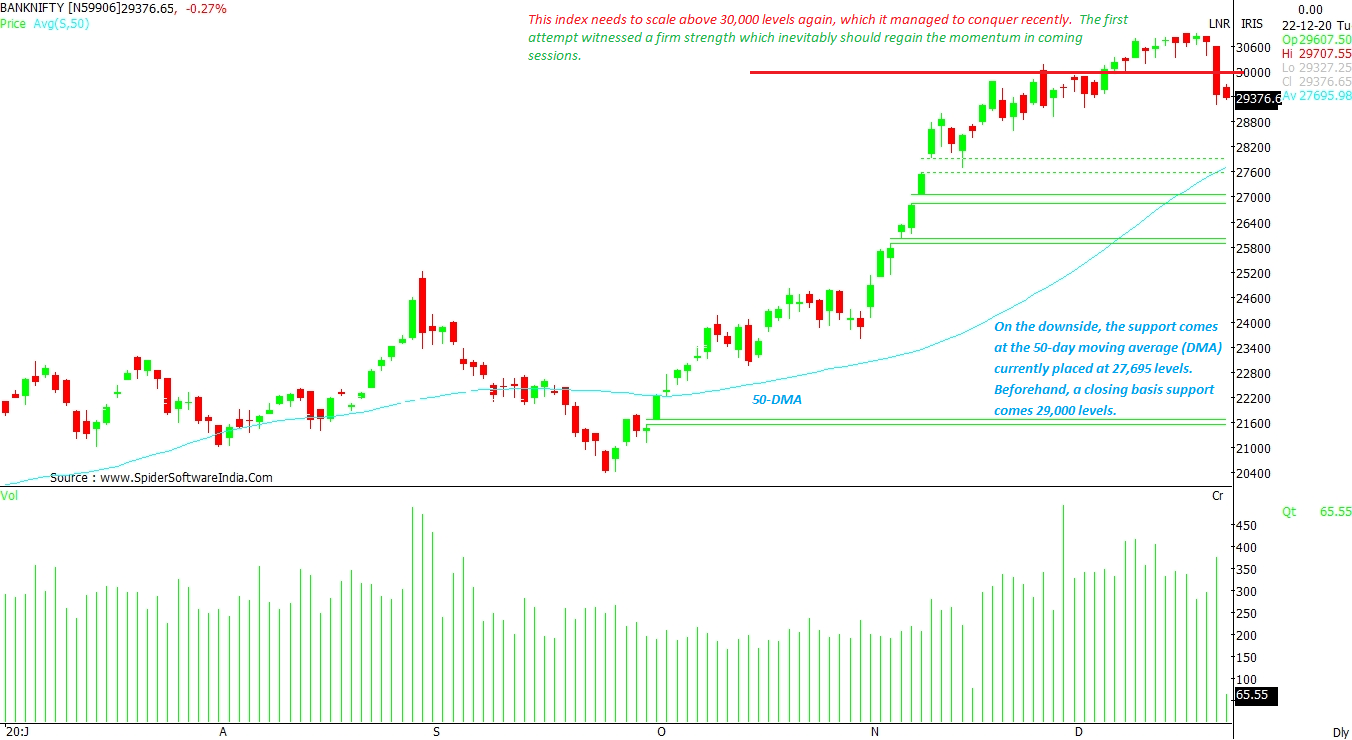
CLICK HERE FOR THE CHART NIFTYBANK: The index needs to scale above 30,000 levels again, which it managed to conquer recently. The first attempt witnessed a firm strength which inevitably should regain the momentum in coming sessions. On the downside, the support comes at the 50-day moving average (DMA), currently placed at 27,695 levels. Beforehand, a closing basis support comes in at 29,000 levels.
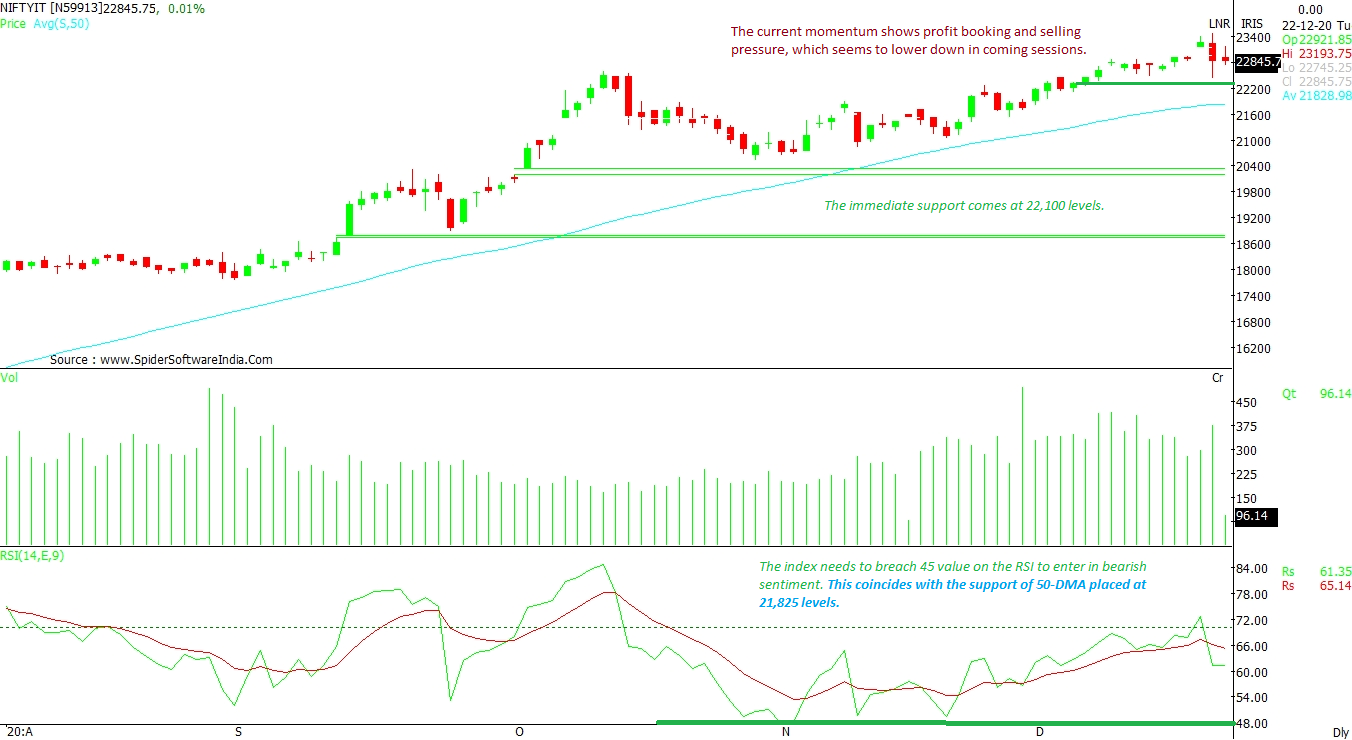
CLICK HERE FOR THE CHART NIFTY IT: The index needs to breach 45 value on the RSI to enter bearish sentiment. This coincides with the support of 50-DMA placed at 21,825 levels. The current momentum shows profit booking and selling pressure, which seems to lower in coming sessions. The immediate support comes at 22,100 levels.
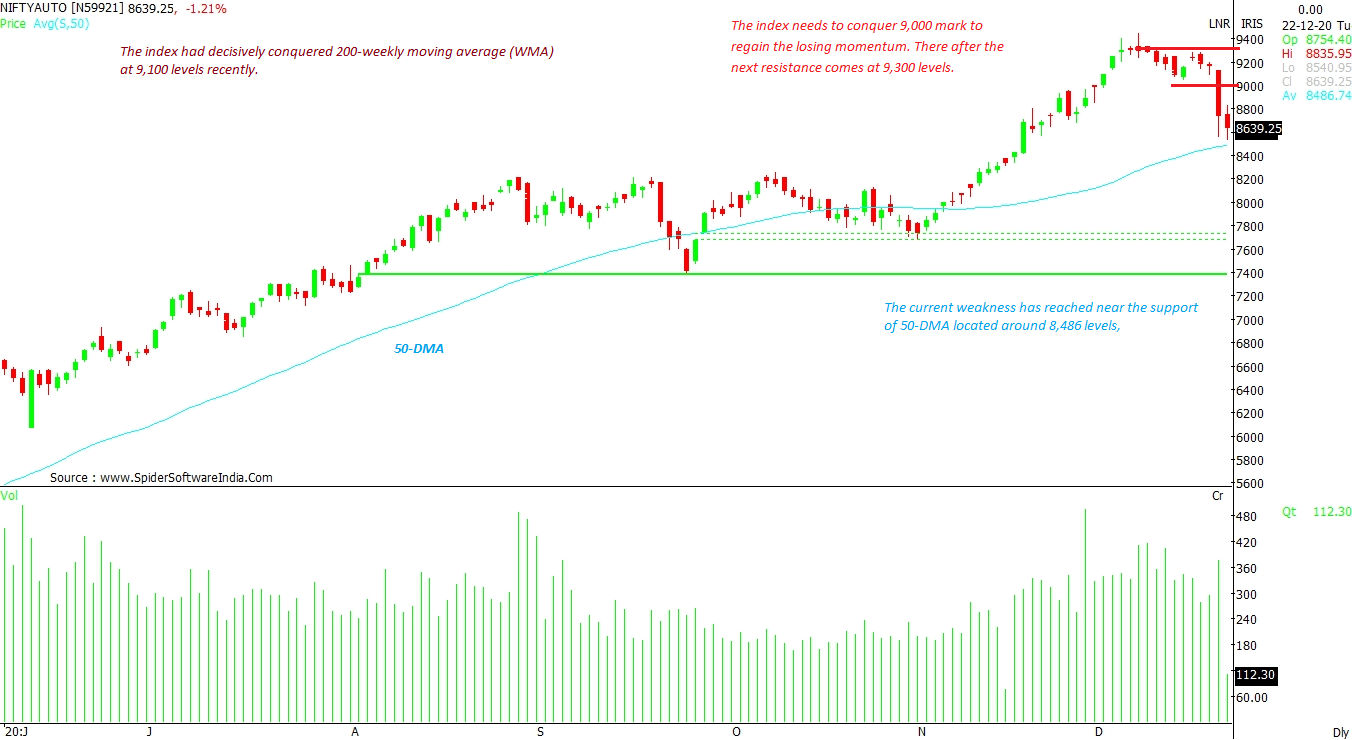
CLICK HERE FOR THE CHART NIFTY AUTO: The index had decisively conquered 200-weekly moving average (WMA) at 9,100 levels recently. The current weakness has reached near the support of 50-DMA located around 8,486 levels, as per the daily chart. The index needs to conquer 9,000 mark to regain the losing momentum. There after the next resistance comes at 9,300 levels.
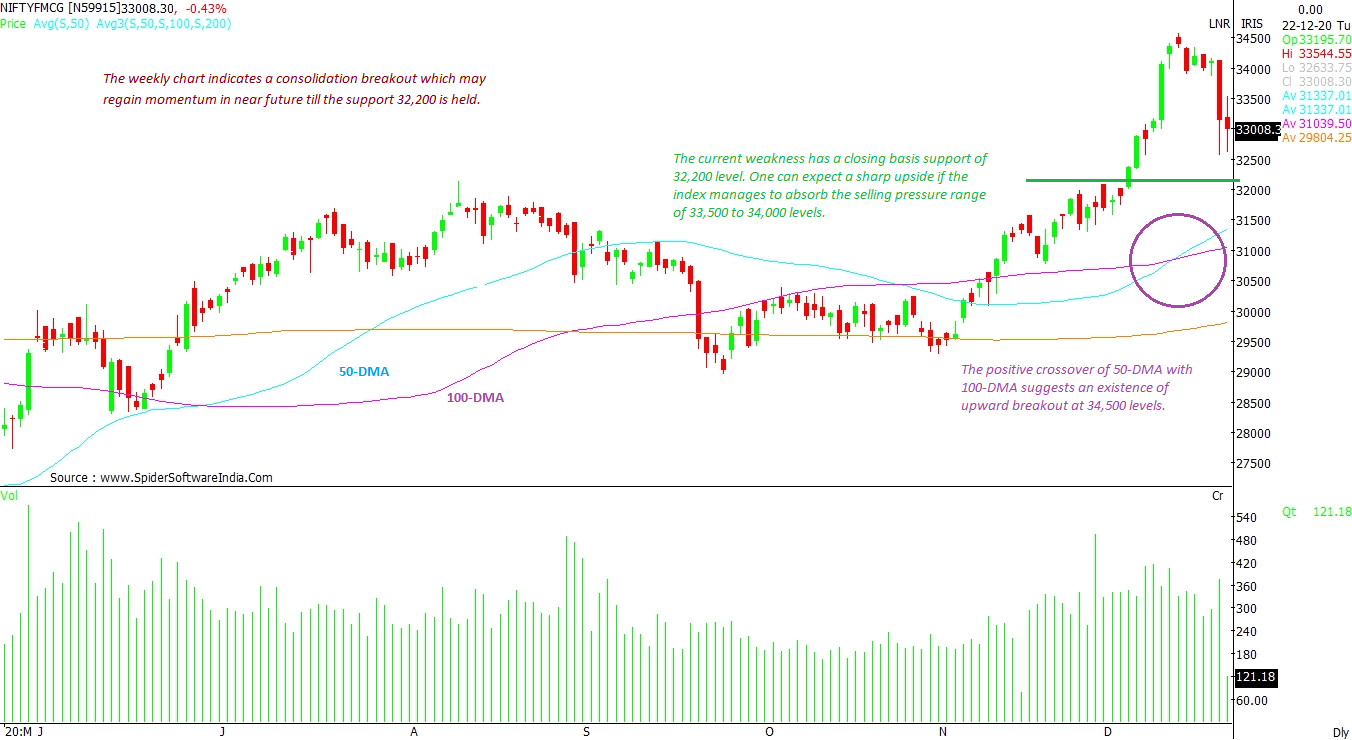
CLICK HERE FOR THE CHART NIFTY FMCG: The positive crossover of 50-DMA with 100-DMA suggests an existence of upward breakout at 34,500 levels. The current weakness has a closing basis support of 32,200 level. One can expect a sharp upside if the index manages to absorb the selling pressure range of 33,500 to 34,000 levels. The weekly chart indicates a consolidation breakout which may regain momentum in near future till the support 32,200 is held.
CLICK HERE FOR THE CHART  "Chart check: Bull-run may not be over just yet for Sensex, Nifty")


