Home / Markets / News / Chart check: Nifty IT down 11% in April; Is it time to buy TCS, HCL Tech?
Chart check: Nifty IT down 11% in April; Is it time to buy TCS, HCL Tech?
Overall, the Nifty IT index has declined 19 per cent from its historic peak of 39,446 recorded in early January, 2022. Charts indicate 31,000 to 30,000 as the accumulation range for the index.
The Nifty IT index is one of the biggest loser in April so far. The index has declined over 11 per cent from its recent highs of 36,800 and continues to drift lower amid the earnings season.
Among the index constituents, Larsen & Toubro InfoTech and L&T Technology Services plummeted over 21 per cent each, followed by Mphasis, Infosys and Tech Mahindra, which tumbled over 15 per cent each.
Overall, the Nifty IT index has declined 19 per cent from its historic peak of 39,446 recorded in early January, 2022.
Prior to that, the Nifty IT index had tripled from the onslaught of Covid-19 sentiment, back in March 2020. The index bounced back, bottoming out at 10,991 and jumped over three-fold to its peak.
Given the present dip of almost 20 per cent, is it an ideal opportunity to buy/ accumulate the stocks or stay on the sidelines. Here’s what the charts indicate for the sector:
NIFTY IT INDEX
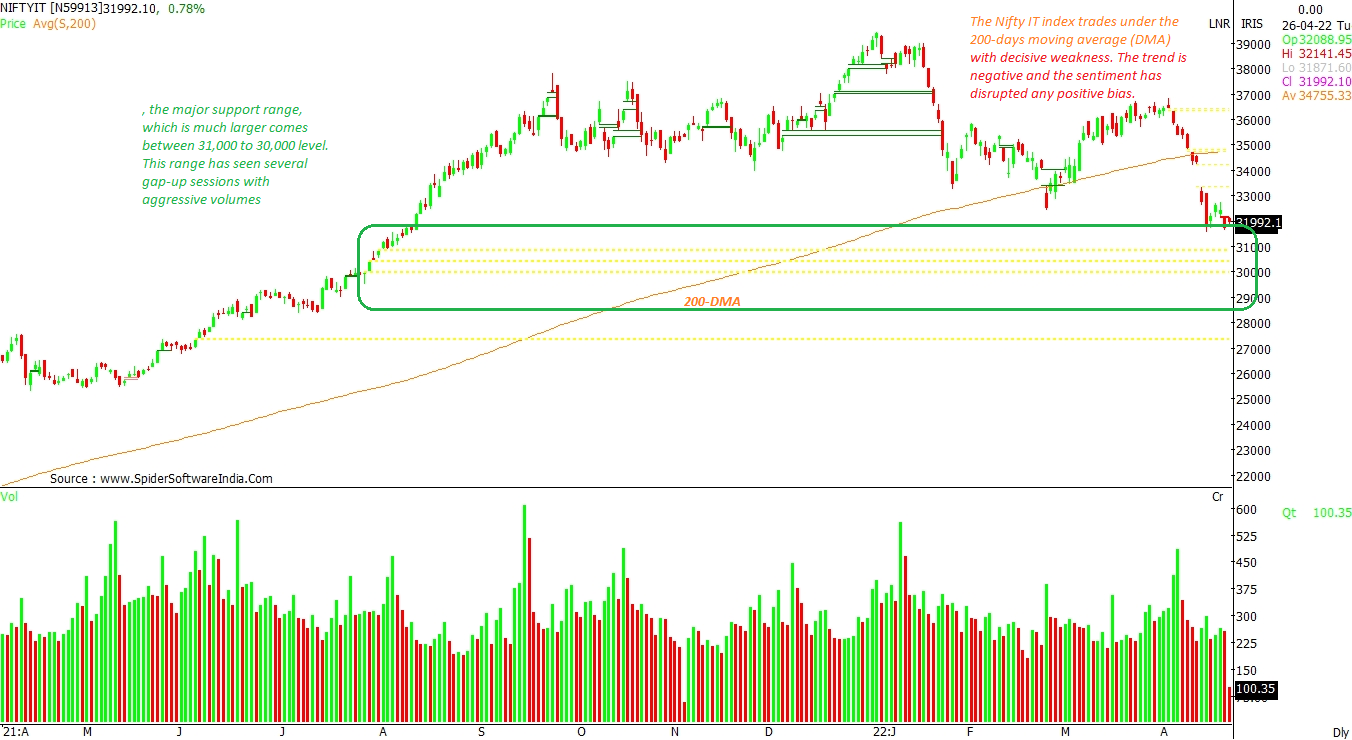
Outlook: accumulation range 31,000 to 30,000
The Nifty IT index trades under the 200-day moving average (DMA) with decisive weakness. The trend is negative and the sentiment has disrupted any positive bias. The 200-DMA is at 34,755. That’s said, the major support range, which is much larger comes between 31,000 to 30,000 level. This range has seen several gap-up sessions with aggressive volumes, shows the daily chart. Thus, a possible decline towards this range could see an accumulation. CLICK HERE FOR THE CHART
Larsen & Toubro Infotech Limited (LTI)
Likely target: Rs 5,600
Upside potential: 16.50%
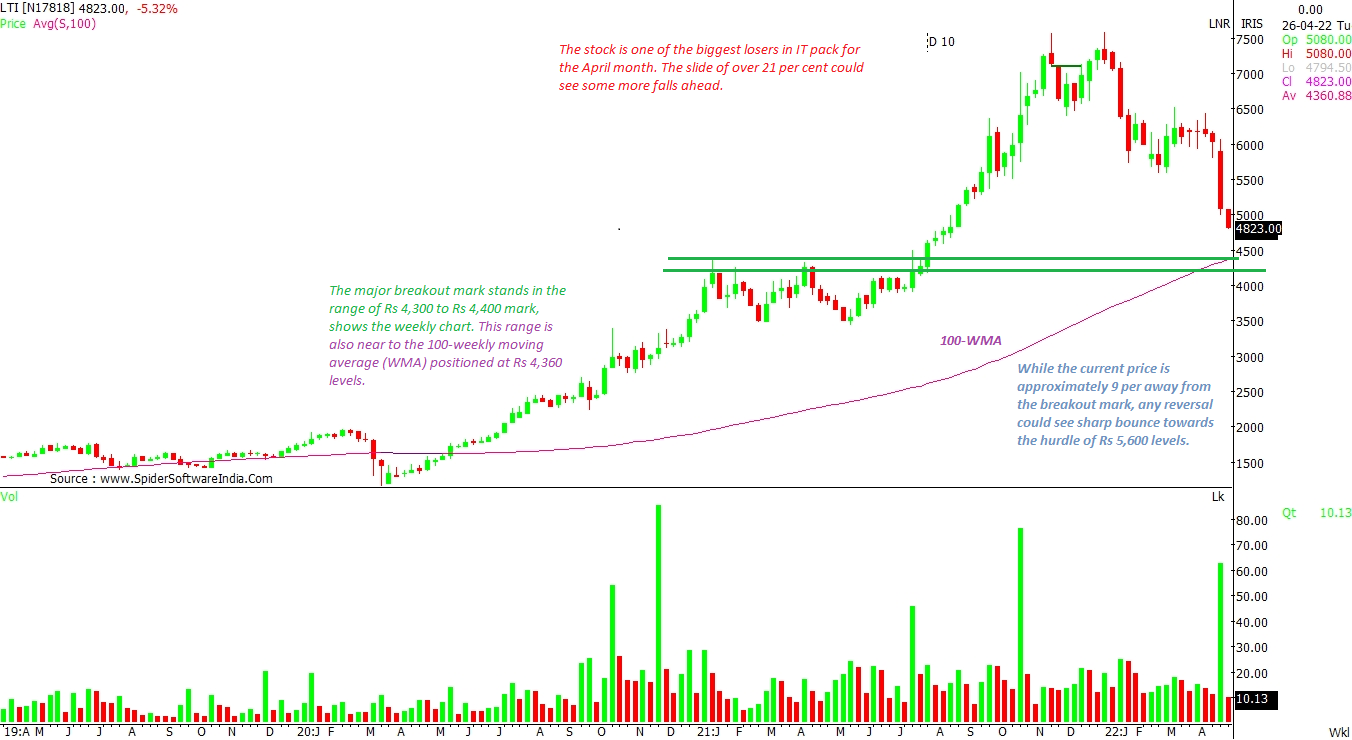
The stock is one of the biggest losers in IT pack this month. The slide of over 21 per cent could see some more fall ahead. The major breakout mark stands in the range of Rs 4,300 to Rs 4,400, shows the weekly chart. This range is also near to the 100-weekly moving average (WMA) positioned at Rs 4,360 level. While the current price is approximately 9 per cent away from the breakout mark, any reversal could see sharp bounce towards the hurdle of Rs 5,600. CLICK HERE FOR THE CHART
MindTree Limited (MINDTREE)
Likely target: Rs 4,200
Upside potential: 12%
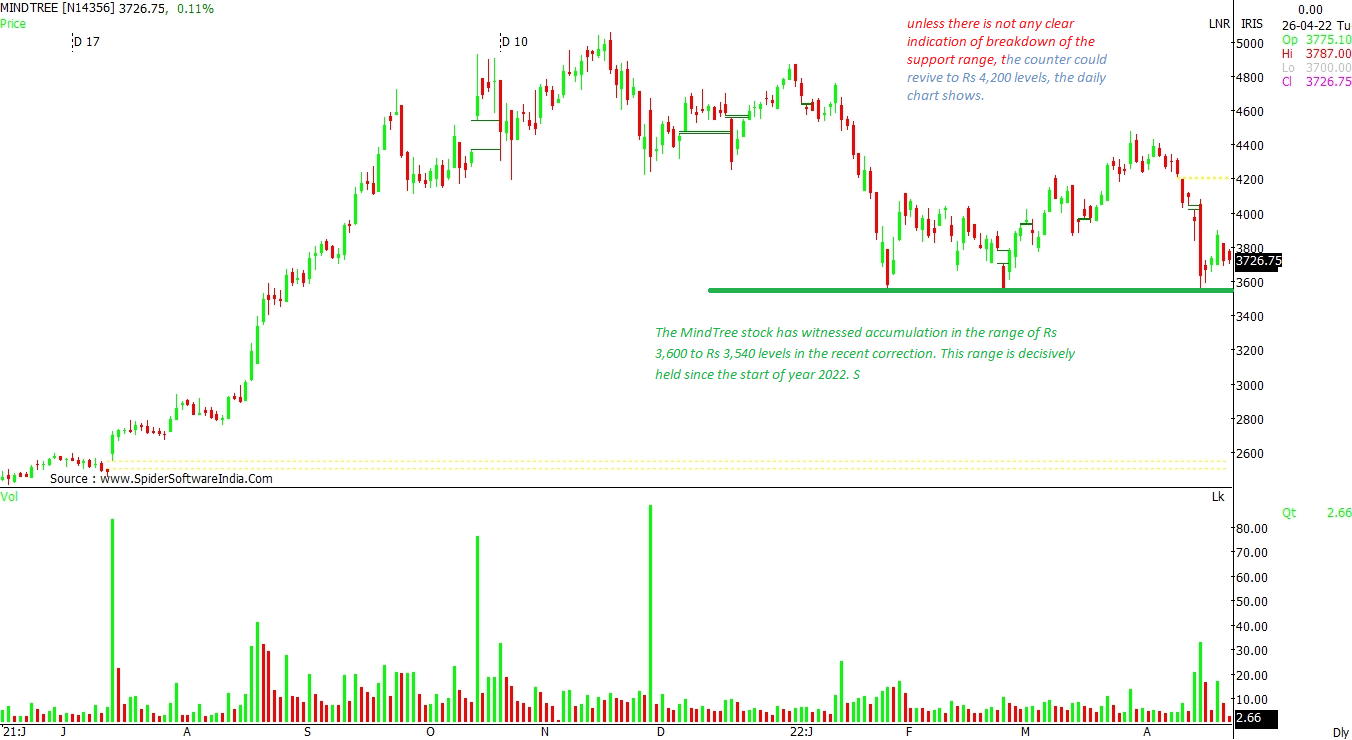
The MindTree stock has witnessed accumulation in the range of Rs 3,600 to Rs 3,540 levels in the recent correction. This range is decisively held since the start of year 2022. So, unless there is not any clear indication of breakdown of this support range, the counter could revive to Rs 4,200 level, the daily chart shows. CLICK HERE FOR THE CHART
Tata Consultancy Services (TCS)
Likely target: Rs 4,000
Upside potential: 11%
TCS has a strong accumulation base between the range of Rs 3,400 to Rs 3,300, shows the weekly chart. The range that broke out in August 2021 tossing 20 per cent gains hitting a peak of Rs 4,034.95. Thus, this range may provide the support for a decent reversal towards Rs 4,000 mark. CLICK HERE FOR THE CHART
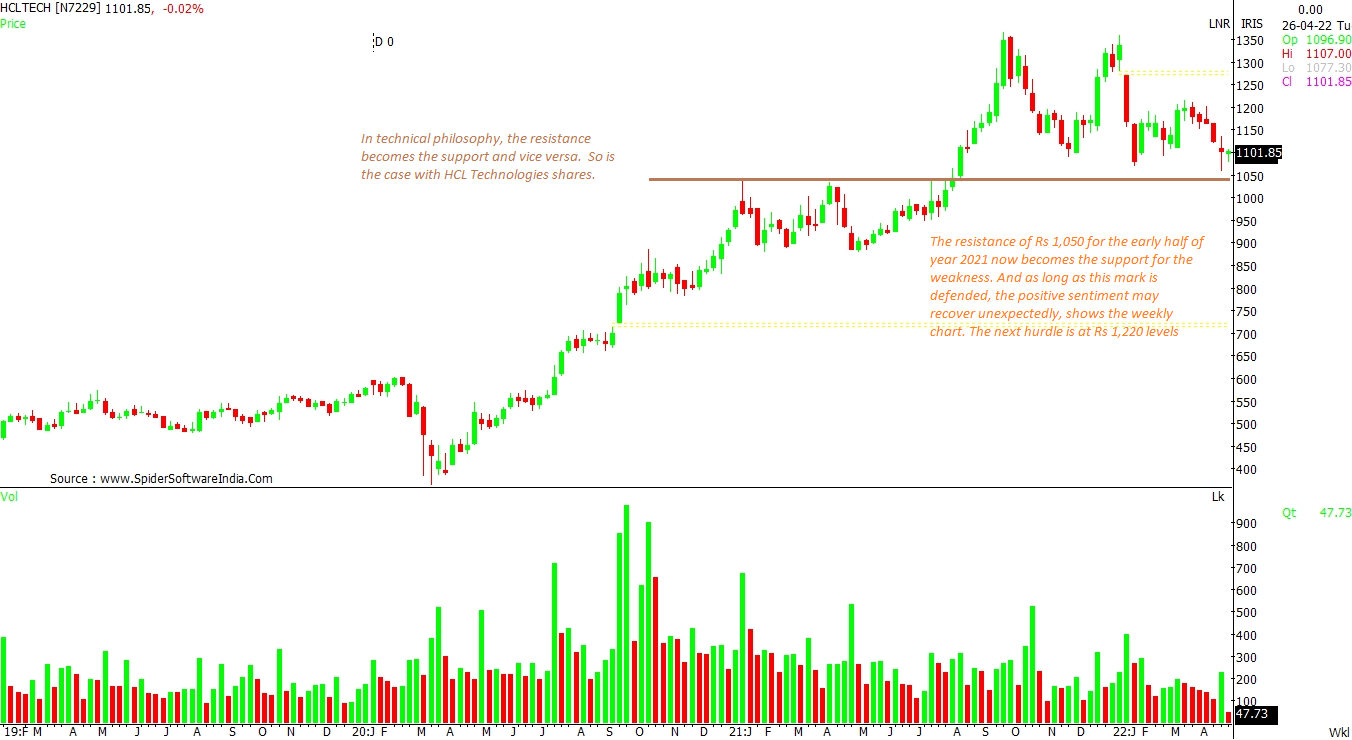
HCL Technologies Limited (HCLTECH)
Likely target: Rs 1,220
Upside potential: 11%
In technical philosophy, the resistance becomes the support and vice versa. So is the case with HCL Technologies shares. The resistance of Rs 1,050 for the early half of year 2021 now becomes the support for the weakness. And as long as this mark is defended, the positive sentiment may recover unexpectedly, shows the weekly chart. The next hurdle is at Rs 1,220 level. CLICK HERE FOR THE CHART
Read this article for free
Register to continue reading premium journalism and analysis from Business Standard.
 "Chart check: Nifty IT down 11% in April; Is it time to buy TCS, HCL Tech?")


