Markets have been mostly range-bound since the last three sessions After hitting a high of 40,000 (Sensex) and 12,000 (Nifty50), the markets have gradually given up the gains and are back to the levels seen on May 24. Despite the fall from the top and the range-bound trade off-late, there are investment-worthy opportunities where the stocks can move up over the next few sessions.
Here are a few such stocks that are showing a positive trend as per their technical chart patterns.
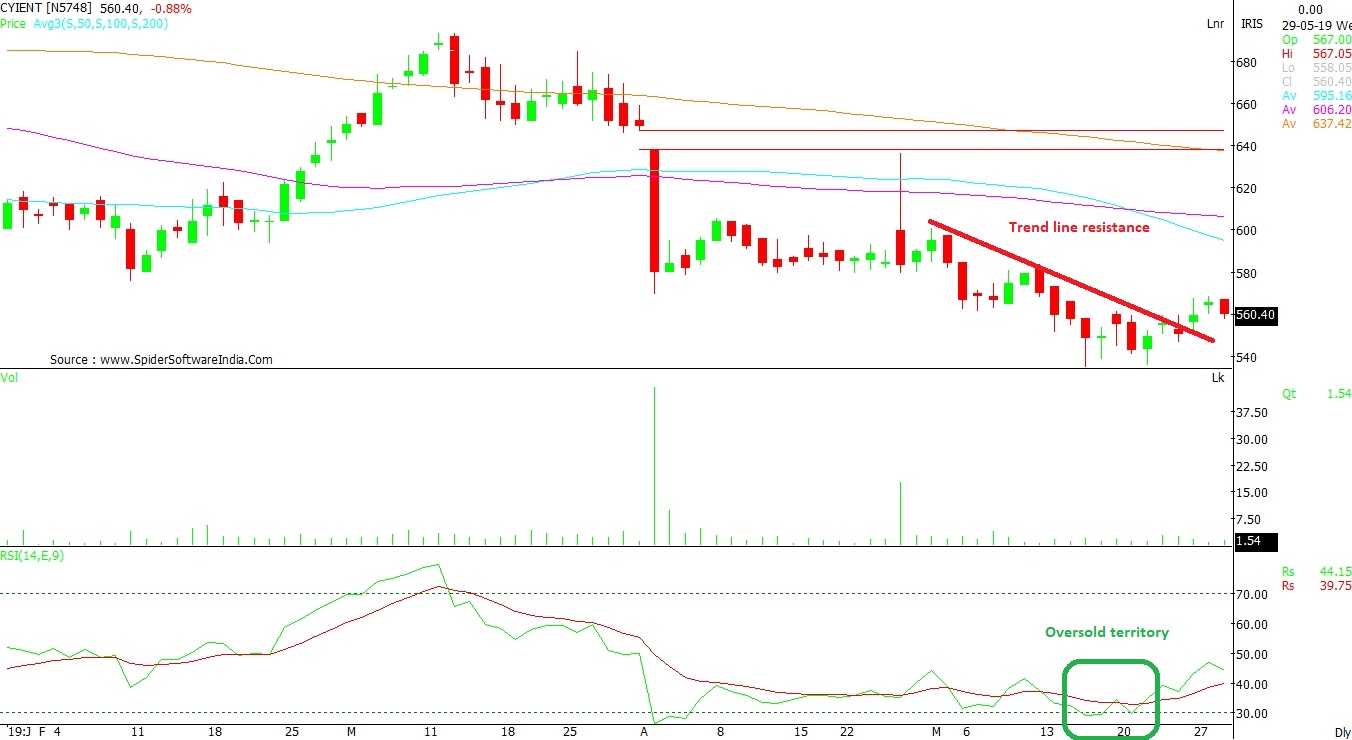
Cyient Ltd (CYIENT): The stock has successfully come out of the oversold territory on Relative Strength Indicator (RSI). Currently, reading at 43, the counter is heading towards the oversold region. The candlestick pattern shows strong buying support around Rs 545 – Rs 547 level, and any correction should eventually see buying come in. A major move is expected above Rs 570, a level that has stood as a strong resistance.
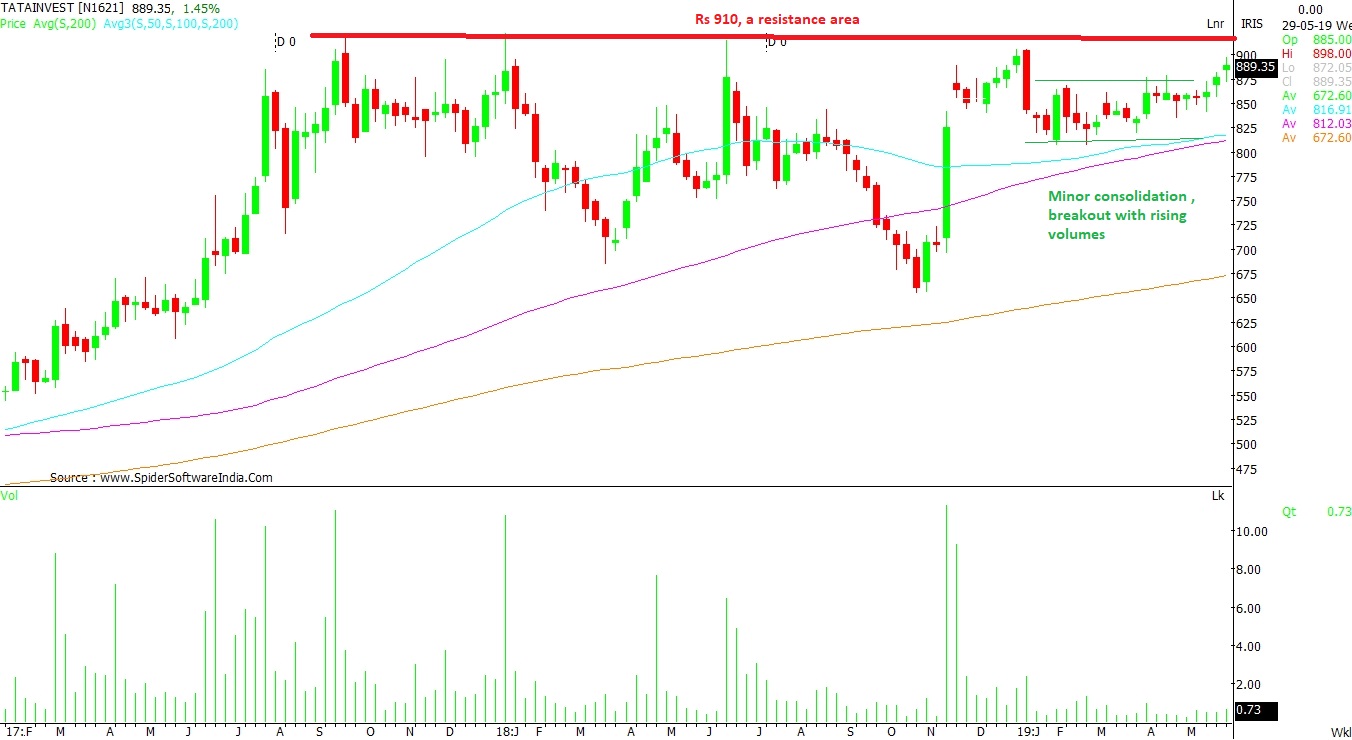
CLICK HERE FOR DETAILED CHART VIEW Tata Investment Corporation (TATAINVEST): This is the fifth time when stock is heading towards its pressure level of Rs 910. One can expect a breakout, as it has consolidated with decent volume - a scenario suggesting strong buying around its support levels. The range of Rs 860 – Rs 865 should stay as a support area. Recently, the 50-day moving average (DMA) has crossed the 100 DMA in daily chart, which is a sign of a rising trend that could lead to Rs 950 and Rs 975 levels.
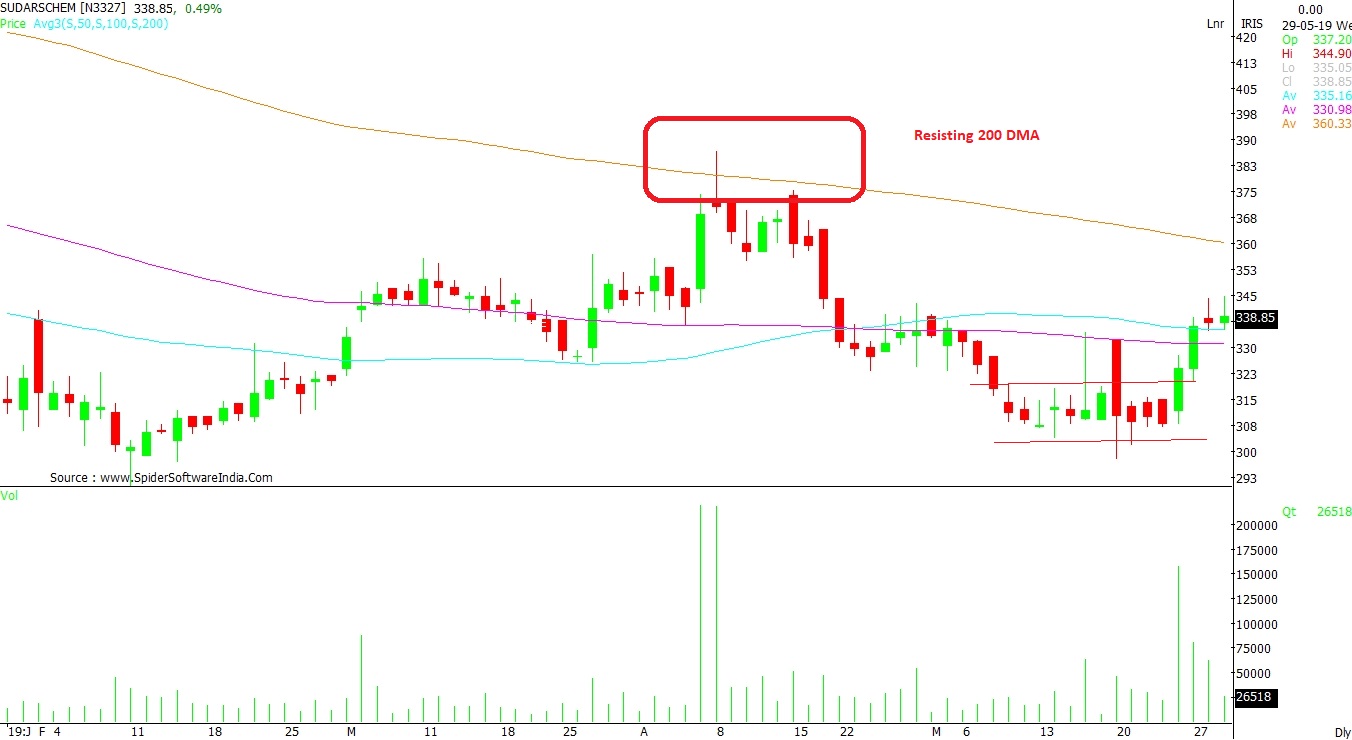
CLICK HERE FOR DETAILED CHART VIEW Sudarshan Chemical Industries (SUDARSCHEM): One can see a negative reversal from 200 DMA on the daily chart. Such a scenario indicates profit booking, which further dampened the trend by breaching 100 DMA and 50 DMA. However, in the last four sessions, there are signs of a recovery. A breach of the above-mentioned averages on the upside can take the counter higher to Rs 360 and above levels. Support comes at Rs 324 and Rs 328.
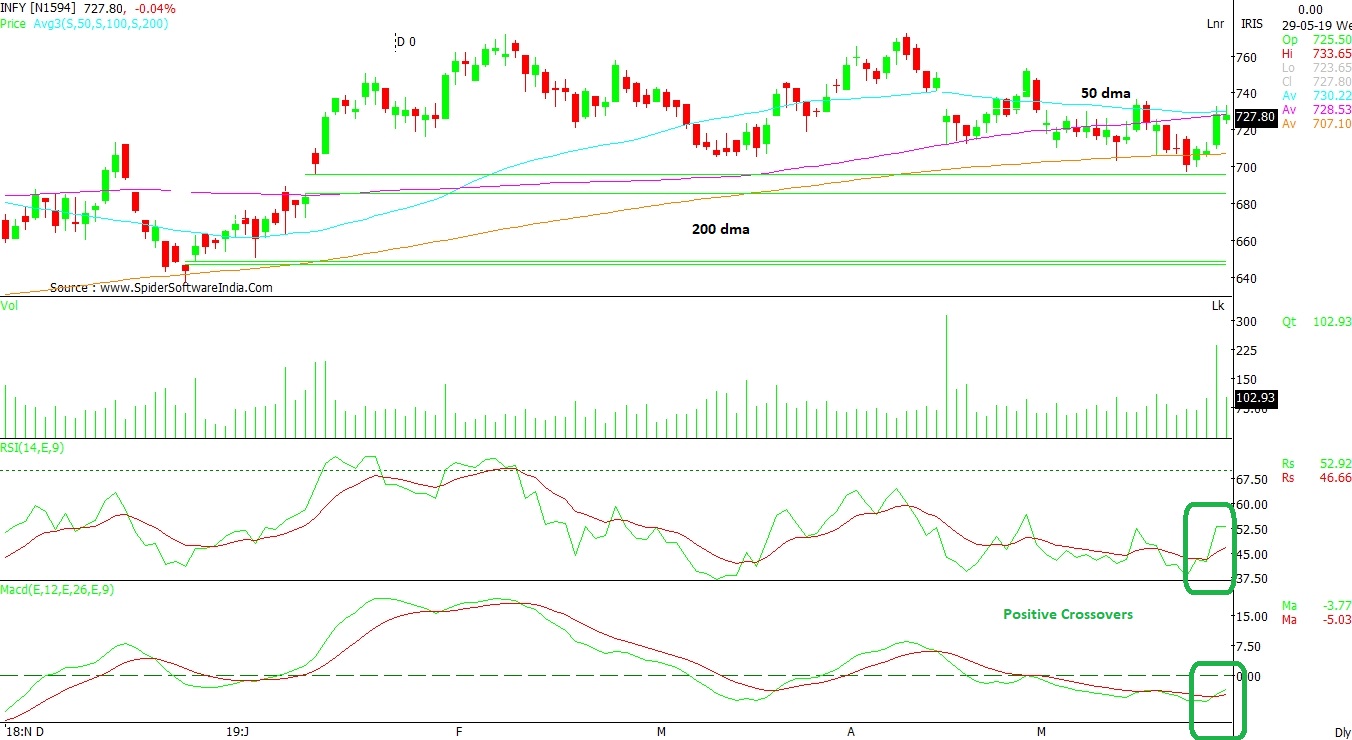
CLICK HERE FOR DETAILED CHART VIEW Infosys (INFY): One of the stocks which are holding buying momentum is this information technology (IT) bell-weather. Its 200 DMA is located at Rs 707 – Rs 700. A trend-line breakout with strong volumes suggests more upside. The stock had started losing steam, as its 50 DMA started falling. However, it has turned upward on breakout, indicating a positive trend. MACD (Moving average convergence and divergence) and RSI have made positive crossovers, which is a sign of revival / uptrend in prices. As the stock move towards Rs 738, more buying is likely to gain strength and the Infosys can head towards Rs 780 and Rs 805 levels going ahead.
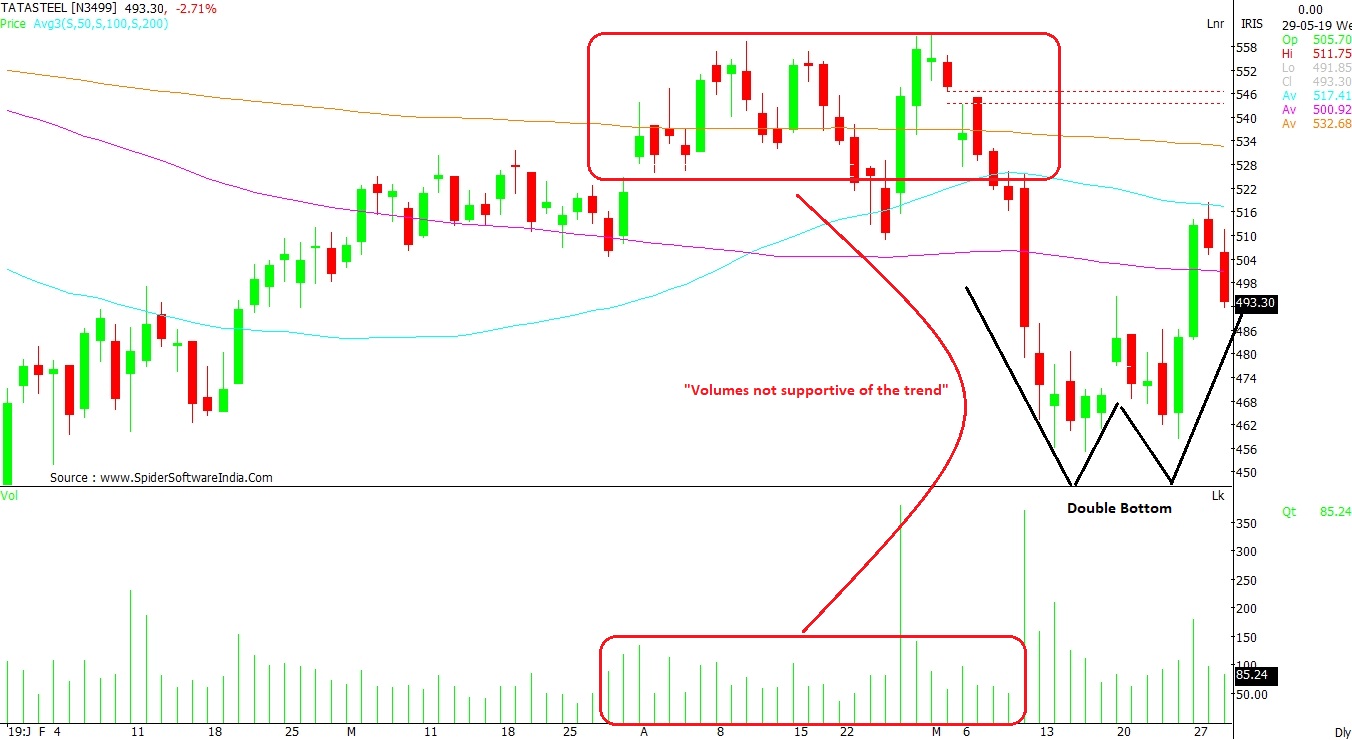
CLICK HERE FOR DETAILED CHART VIEW Tata Steel (TATASTEEL): Although it is trading below 200-days moving average (DMA), the stock has not broken 200-weekly moving average (WMA) since August 2018. It did manage to climb above 200 DMA in the month of April, but failed to regain follow-up buying. The current formation as per charts reveals a “Double Bottom”, suggesting another upside in the days ahead. As a result, Tata Steel can conquer its 200 DMA at Rs 532. A mild resistance stays at 50 DMA, placed around Rs 518 levels. In case there is a correction owing to the overall weakness in the market, one can expect buying re-emerge around its support level of Rs 490 – Rs 485.
CLICK HERE FOR DETAILED CHART VIEW "Cyient, Tata Steel, Infosys: Stocks likely to rise in a range-bound market")


