Apart from these, Indusind Bank ralled 4 per cent after the Securities and Exchange Board of India (Sebi) provided an additional two weeks to the bank's promoters for infusion of residual capital in lieu of conversion of warrants issued to them last year worth over Rs 2,695 crore.
Here's how these stocks look from a technical viewpoint
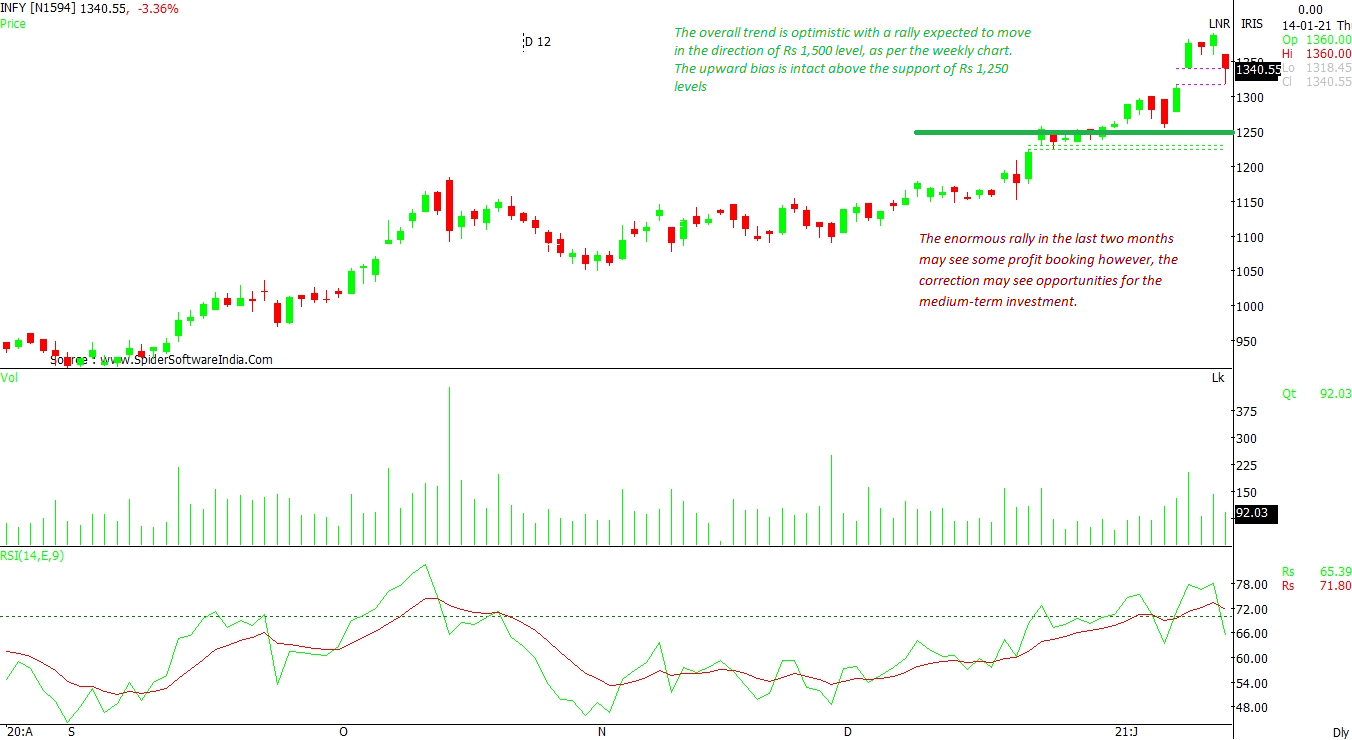
Infosys Ltd (INFY): The IT giant's overall trend is optimistic with a rally expected to move in the direction of Rs 1,500 level, as per the weekly chart. The upward bias is intact above the support of Rs 1,250 levels, as per the daily chart. The enormous rally in the last two months may see some profit booking. However, the correction may provide opportunities for the medium-term investment.
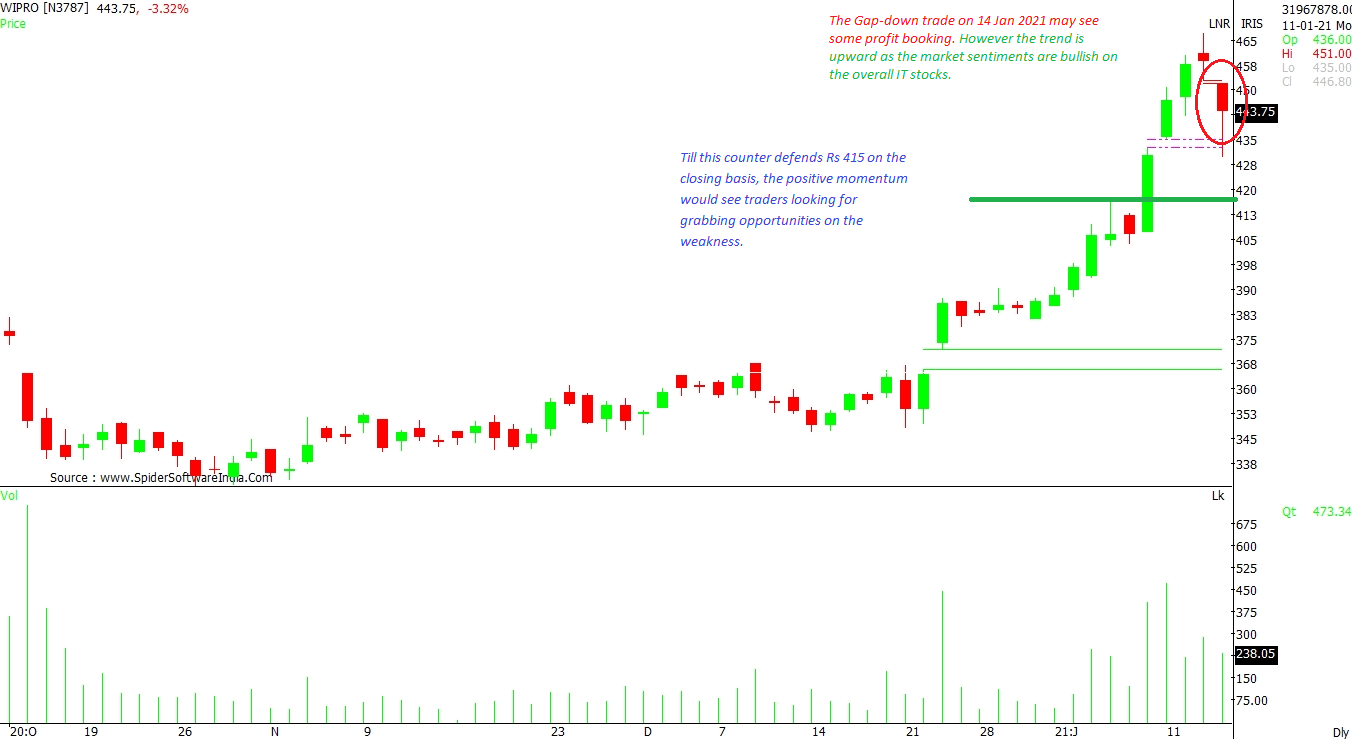
CLICK HERE FOR THE CHART Wipro Ltd (WIPRO): The Gap-down trade on Thursday (January 14, 2021) may see some profit booking. However, the trend is upward as the market sentiments are bullish on the overall IT stocks. Till this stock defends Rs 415 on the closing basis, the positive momentum would see traders looking for opportunities on the weakness.
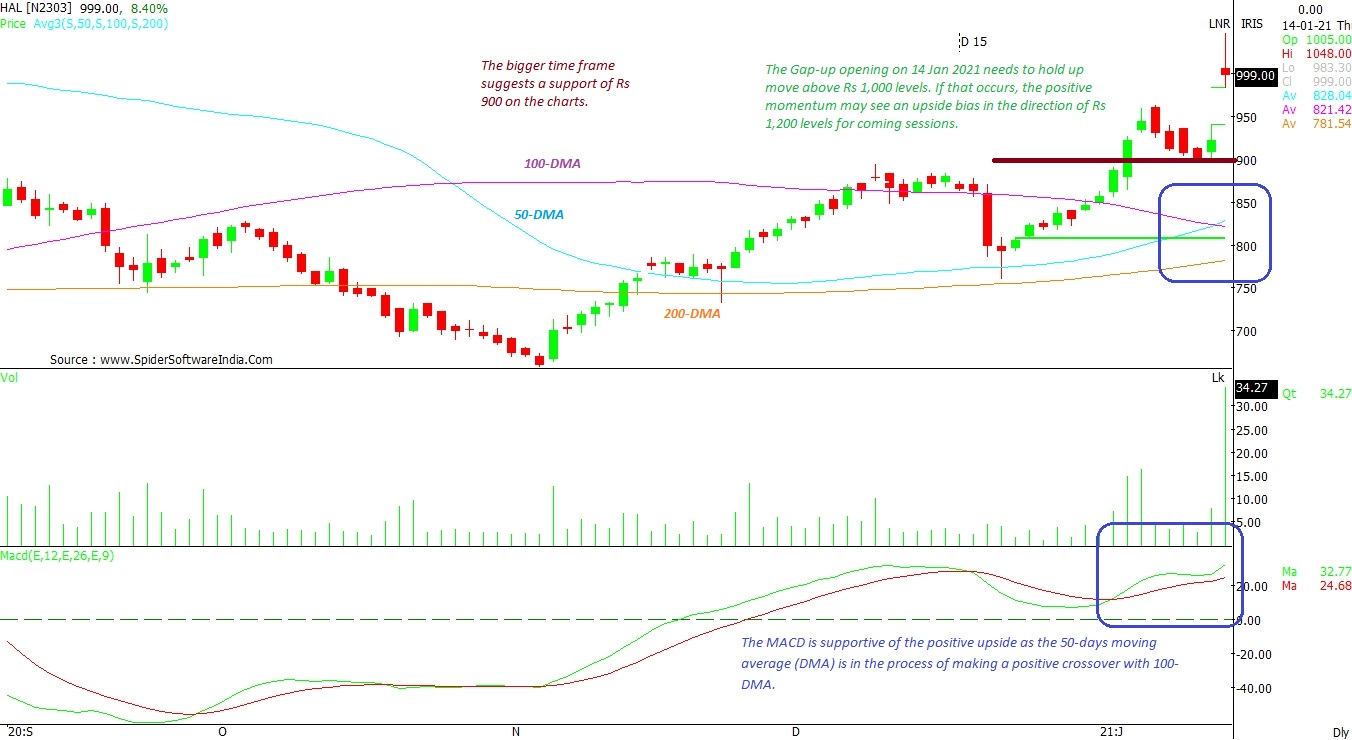
CLICK HERE FOR THE CHART Hindustan Aeronautics Ltd (HAL): The Gap-up opening on Thursday needs to hold the up move above Rs 1,000 levels, in which case, the positive momentum may see an upside bias in the direction of Rs 1,200 levels for coming sessions. The bigger time frame suggests a support of Rs 900 on the charts. The Moving Average Convergence Divergence (MACD) is supportive of the positive upside as the 50-days moving average (DMA) is in the process of making a positive crossover with 100-DMA.
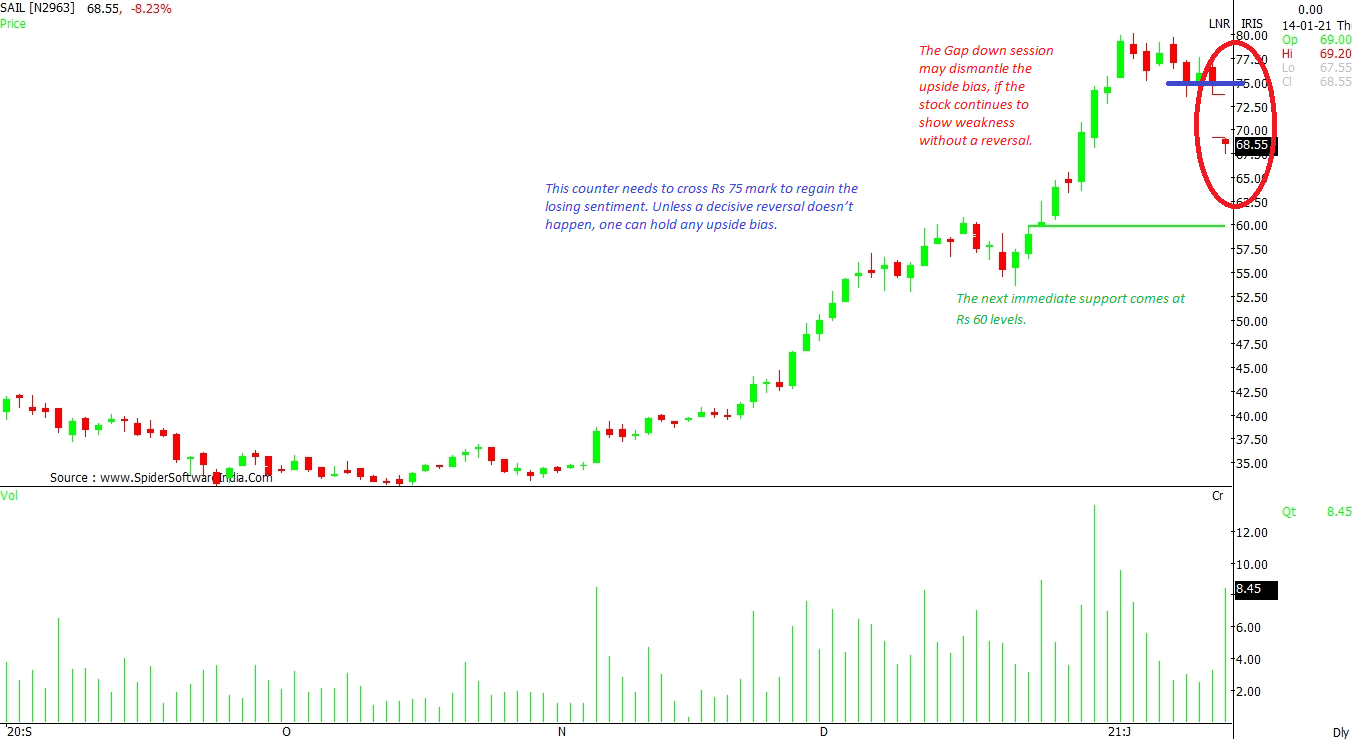
CLICK HERE FOR THE CHART Steel Authority of India Ltd (SAIL): The Gap-down session may dismantle the upside bias, if the stock continues to show weakness without a reversal. The state-owned entity's stock needs to cross Rs 75-mark to regain the positive sentiment. Unless a decisive reversal happens, one should not hold any upside bias.. The next immediate support comes at Rs 60 levels.
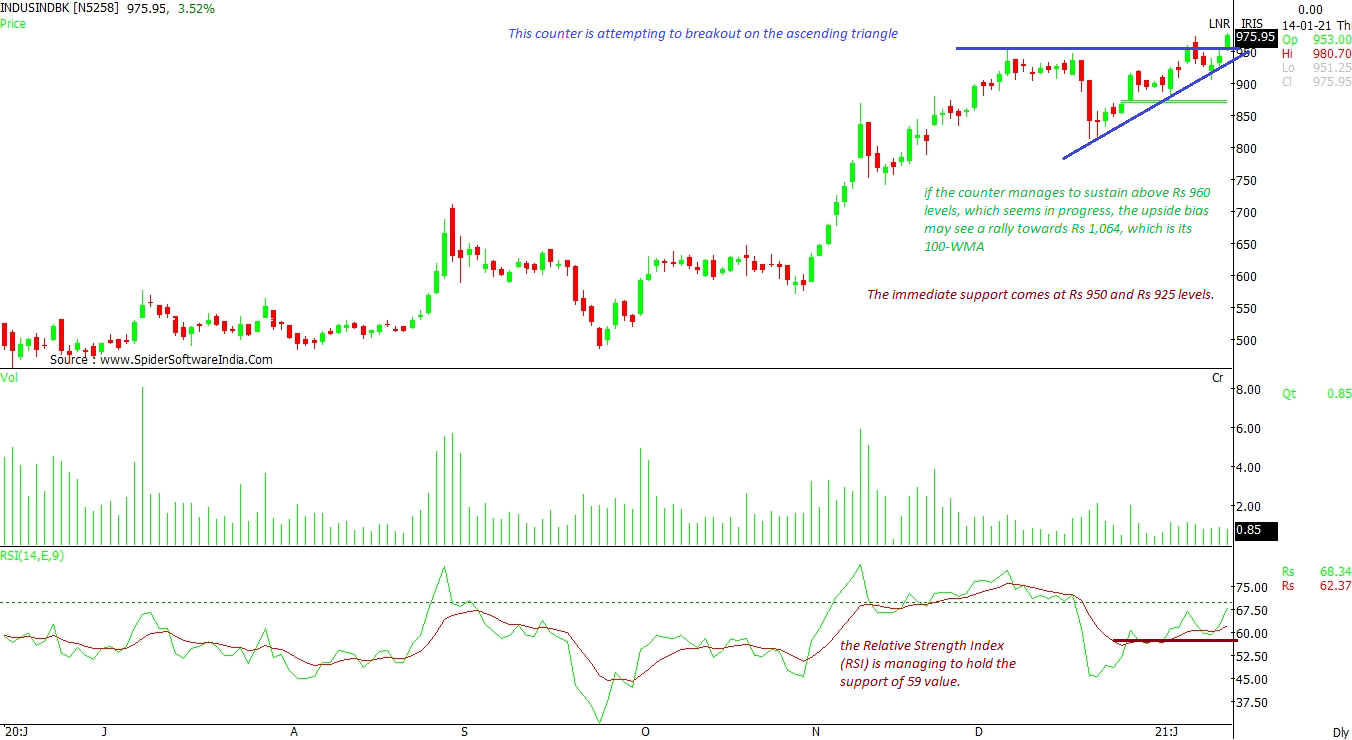
CLICK HERE FOR THE CHART IndusInd Bank Ltd (INDUSINDBK): This is attempting to breakout on the ascending triangle, as per the daily chart. Even, the Relative Strength Index (RSI) is managing to hold the support of 59 value. Going forward, if the counter manages to sustain above Rs 960 levels, which seems to be in progress, the upside bias may see a rally towards Rs 1,064, which is its 100-weekly moving average (WMA). The immediate support comes at Rs 950 and Rs 925 levels.
CLICK HERE FOR THE CHART  "HAL, Wipro, Infosys: Trading strategies for news-driven stocks")


