Here's how you can use Bollinger Bands to spot trading opportunities

It gives signals that can establish a potential trade. The accuracy is decent and the trader needs to be on his toes to capture the price move.

technicals
When the Bollinger Bands squeeze, the breakout seems to be in formation.
Avdhut Bagkar Mumbai
3 min read Last Updated : May 14 2020 | 9:25 AM IST
Bollinger Bands are a type of statistical chart characterizing the prices and volatility over time of a financial instrument or commodity and were invented by John Bollinger, who charted two standard deviation lines around the simple moving average (SMA) to identify the deviation in price. The line above the SMA is denoted as upper Bollinger line and the line below as lower Bollinger band. Normally, the simple moving average is 20-day SMA and acts as a middle level between the two bands.

Traders can modify the standard deviation values depending on their preferences. However, the traditional value -- which is two standard deviations on either band -- is usually followed across trading platforms. Standard deviation measures the rise or a fall of a stock from its one-month average price. Basically, identifying the difference of a price that can deviate in either direction.

What do Bollinger Bands tell you?

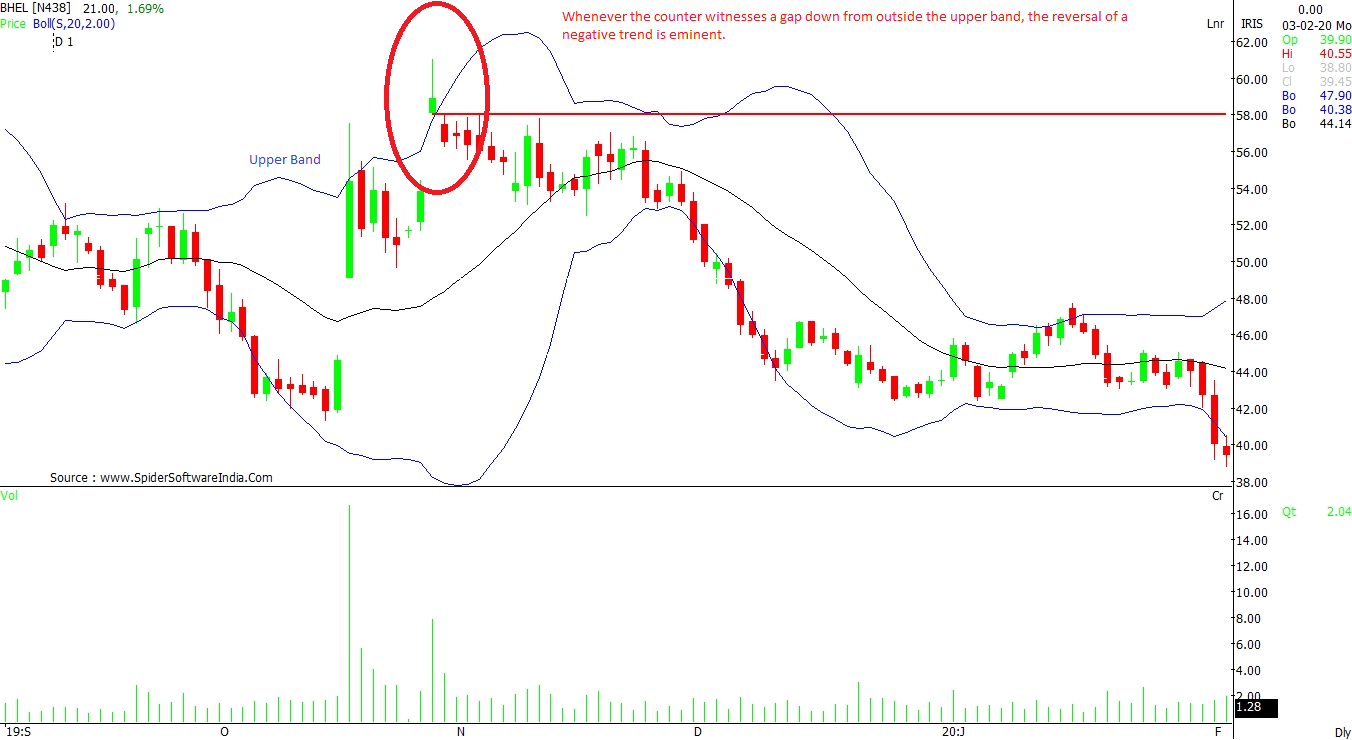
1. Once the price trades above the upper Bollinger band, the selling pressure or profit booking is expected to emerge.

2. The simple 20-day moving average indicates the trend of a stock. A price above 20-SMA shows a positive bias and vice-versa.

3. When the Bollinger Bands squeeze, the breakout seems to be in formation.

4. The trend is said to change when the opposite band starts turning. In bullish market, the moment the lower band starts turning upward, it indicates profit booking.

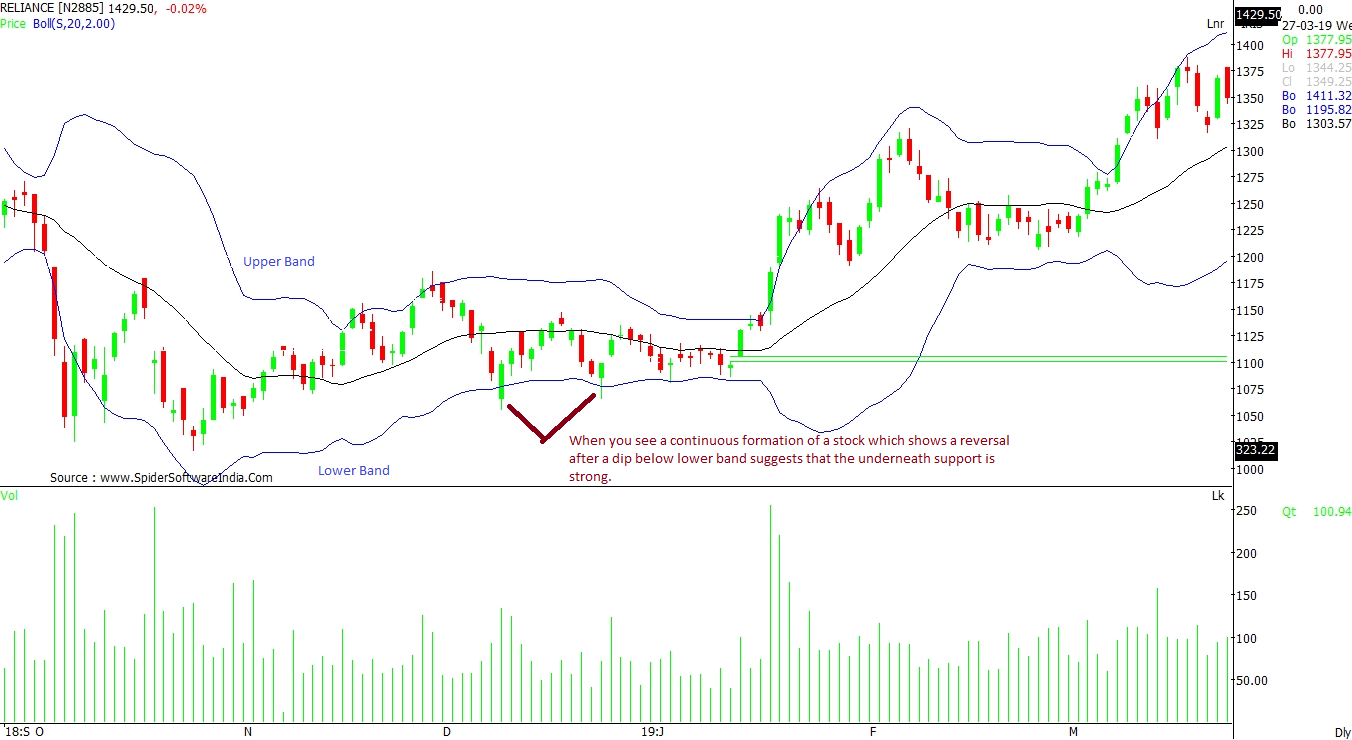
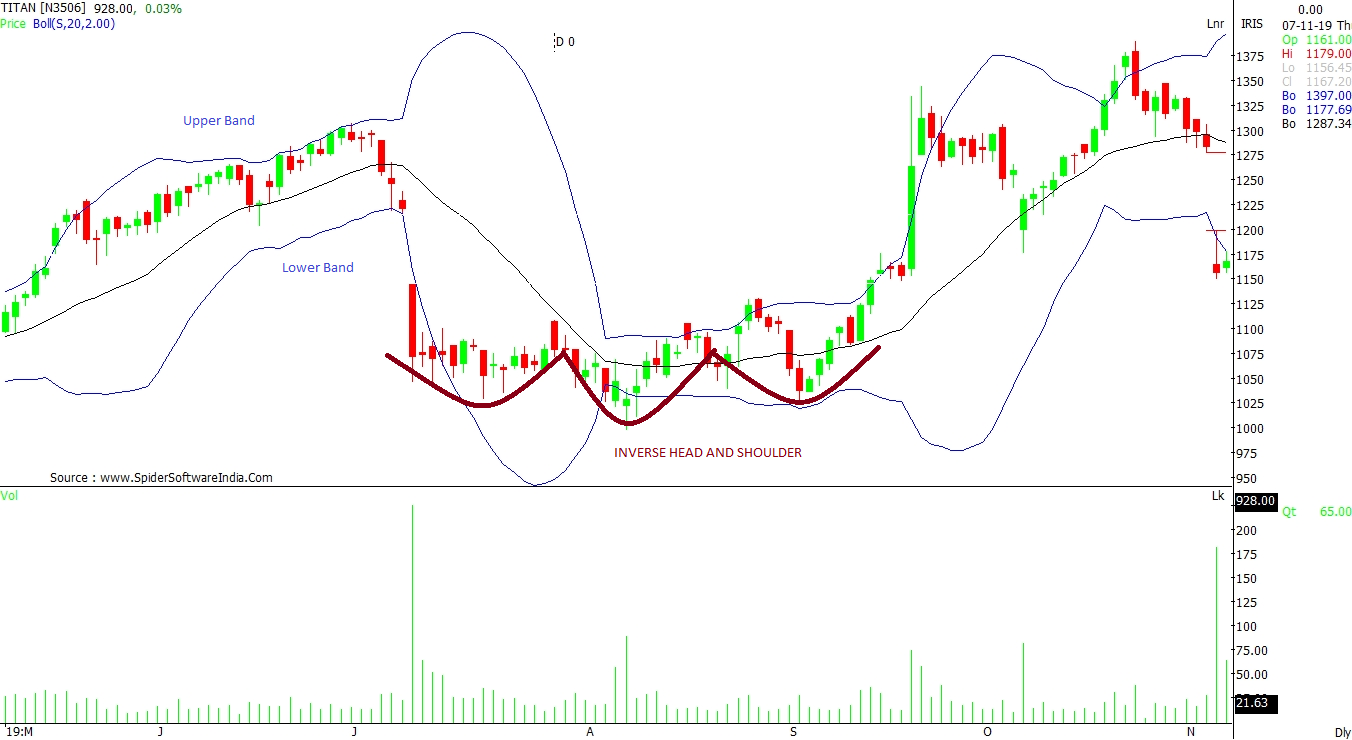
5. Bollinger Band says that the price always trades within the upper and lower bands. Whenever the price goes beyond either band, it has to retrace back within the bands' range.

Can Bollinger Bands be used for intra-day trading?

Bollinger Bands is utilized for short-term to long-term trading. For intraday trades, the indicator lags the potential to give the signals. The price movement is so volatile that the entry and exit points are difficult to gauge in short span. That said, it indeed gives signals that can establish a potential trade. The accuracy is decent and the trader needs to be on his toes to capture the price move.

Difference between Bollinger Bands and Keltner Channel?

Both the indicators look similar to each other, however, the formation is diverse. Bollinger Bands uses Standard deviation and Keltner channel uses average true range (ATR) - a measure of volatility - in computation.  

How to co-relate Bollinger Bands with chart patterns / candlesticks?

Reversal on dips – When a stock repeatedly shows a reversal after a dip below the lower band, it suggests that the underneath support is strong. The bulls are regaining the positive momentum and the stock is about to witness upward move. CLICK HERE FOR THE CHART

Gap up / Gap Down – Whenever the counter witnesses a gap down from outside the upper band, the reversal to a negative trend is eminent. The momentum of a price outside these bands shows extreme volatility and the stock can take severe direction based on the next candlestick. CLICK HERE FOR THE CHART

Chart Patterns – The most recurring formations like Head and Shoulder, Inverse Head and Shoulder, Double top, Double Bottom indicate strong robust rally. Identification of a breakout is tough. Bollinger bands help to decode the breakout level whenever the stock shows momentum towards the upper or lower band. CLICK HERE FOR THE CHART

One subscription. Two world-class reads.

Already subscribed? Log in

Subscribe to read the full story →
*Subscribe to Business Standard digital and get complimentary access to The New York Times

Smart Quarterly

₹900

3 Months

₹300/Month

SAVE 25%

Smart Essential

₹2,700

1 Year

₹225/Month

SAVE 46%
*Complimentary New York Times access for the 2nd year will be given after 12 months

Super Saver

₹3,900

2 Years

₹162/Month

Subscribe

Renews automatically, cancel anytime

Here’s what’s included in our digital subscription plans

Exclusive premium stories online

  • Over 30 premium stories daily, handpicked by our editors

Complimentary Access to The New York Times

  • News, Games, Cooking, Audio, Wirecutter & The Athletic

Business Standard Epaper

  • Digital replica of our daily newspaper — with options to read, save, and share

Curated Newsletters

  • Insights on markets, finance, politics, tech, and more delivered to your inbox

Market Analysis & Investment Insights

  • In-depth market analysis & insights with access to The Smart Investor

Archives

  • Repository of articles and publications dating back to 1997

Ad-free Reading

  • Uninterrupted reading experience with no advertisements

Seamless Access Across All Devices

  • Access Business Standard across devices — mobile, tablet, or PC, via web or app

Topics :stocks technical analysistechnical analysisMarket technicalstechnical chartsDaily technicalstechnical callls

Next Story