Here's why moving averages are a must for your trading model

Intra-day traders consider lower averages such as 9-DMA, 13-DMA, 20-DMA as this helps traders with swing trades wherein they want to capture profits on the day-to-day basis while mitigating risk.

broker, market, shares, trading, stocks, growth, profit, loss, exchange, brokerage
From a broad perspective, the major moving average tracked is the 200-DMA.
Avdhut Bagkar Mumbai
3 min read Last Updated : Oct 15 2020 | 8:57 AM IST
One of the simplest techniques to gauge the trend of a stock/market is Moving Average. It is classified as the average value of a security over a specified period. Usually, when the price trades above the average, the trend is considered as bullish and when the price falls below the average, the sentiment is said to be bearish.

Most common moving averages

There are various moving averages that assist in identifying the sentiment of a stock. The basic and most effective averages are 50-day moving average (50-DMA), 100-DMA, and 200-DMA. The combinations of these moving averages often indicate substantial movement in the stock price.

Intra-day traders consider lower averages (eg: 9-DMA, 13-DMA, 20-DMA) as this helps traders with swing trades wherein they want to capture profits on the day-to-day basis while mitigating risk.

From a broad perspective, the major moving average tracked is the 200-DMA. Securities trading above or crossing 200-DMA on the monthly chart attract attention from even investors, resulting in a steady up trend that later on builds follow-up buying.

Significance of Moving average (MA)

o As the average is arrived on the basis of past data points using a mathematical formula, it assists in filtering out the ‘noise’ and attempts to provide a smooth and clear view on the securities.

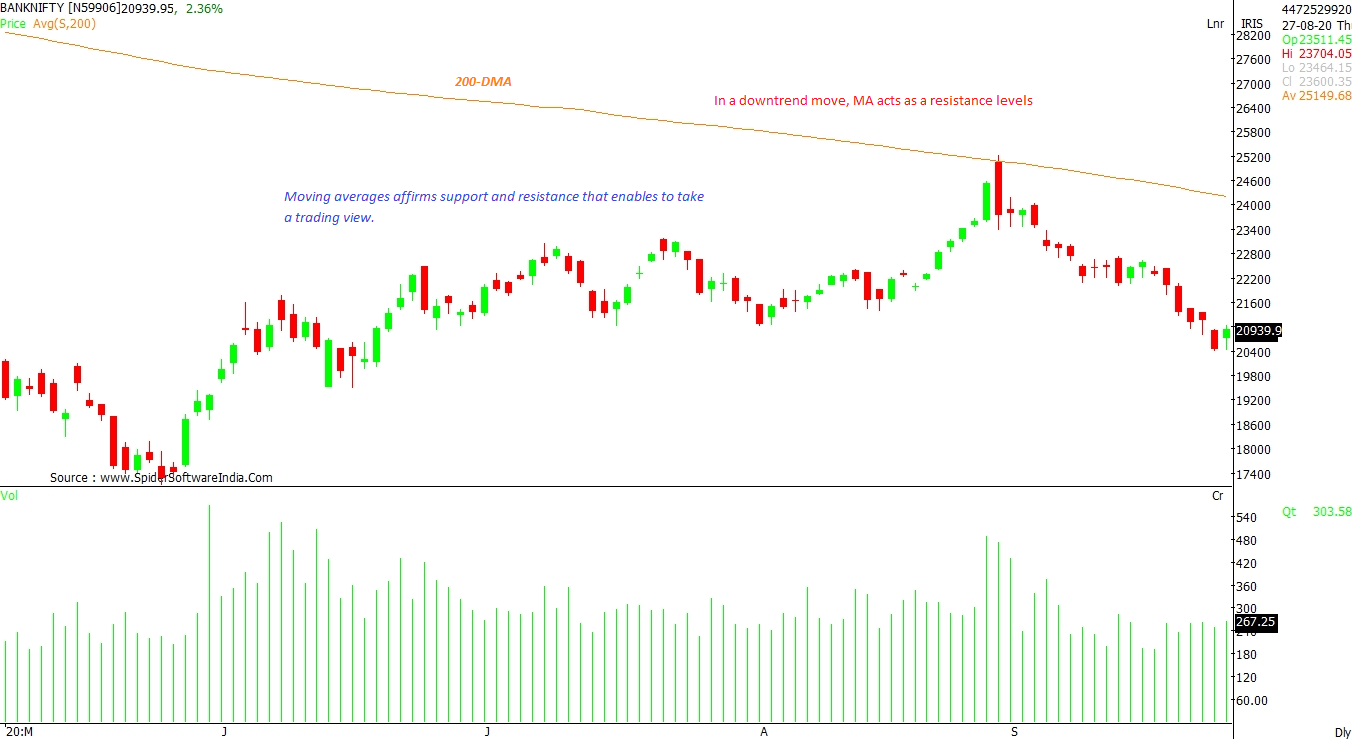
o Moving averages affirm support and resistance that enable one to take a trading view

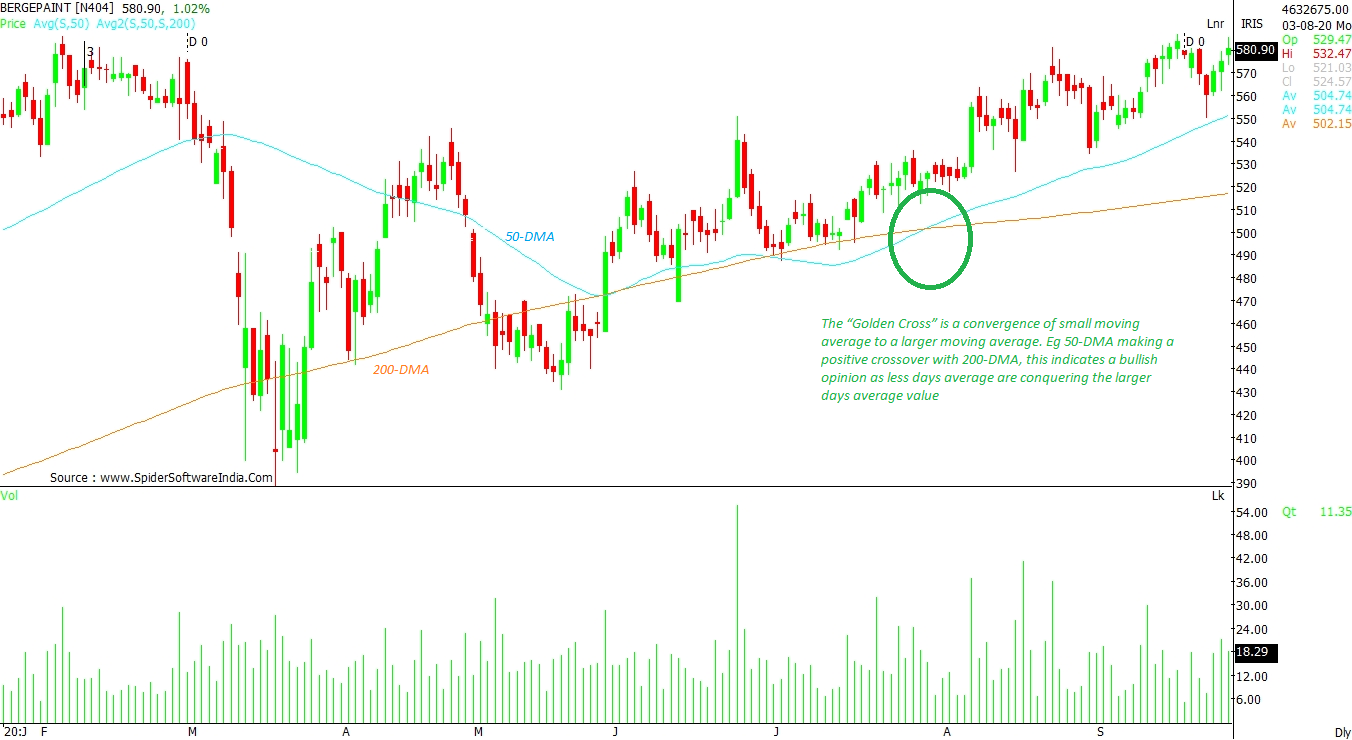
o The intersection of moving averages helps one acknowledge the shift in sentiment.

o In trending markets, MAs help one understand the corrective support levels

o In a downtrend move, moving averages act as resistance levels. CLICK HERE TO VIEW CHART

Variants of moving averages

There are two types of moving averages: Simple moving average (SMA) and Exponential moving average (EMA). The SMA gives equal weightage to all the data points; while, EMA applies more weight to the recent data. The EMA facilitates trading when one is attempting to make swing profits, or quick trades, as it reflects change in move rather quickly. Whenever the stock breaks out above the hurdle, the EMA provides a swift signal.

Golden / Death Cross

The crossover of moving averages is commonly recognized as a trading signal. This reflects the change in sentiment which inevitably impacts the price. The 'Golden Cross' is a crossing of small moving average with a larger moving average. eg 50-DMA making a positive crossover with 200-DMA, which indicates a bullish outlook as the shorter moving average is conquering the longer moving average value. Likewise, 'Death cross' gives a negative outlook with the 200-DMA crossing the 50-DMA negatively, suggesting a bearish mood going forward. CLICK HERE TO VIEW CHART

One subscription. Two world-class reads.

Already subscribed? Log in

Subscribe to read the full story →
*Subscribe to Business Standard digital and get complimentary access to The New York Times

Smart Quarterly

₹900

3 Months

₹300/Month

SAVE 25%

Smart Essential

₹2,700

1 Year

₹225/Month

SAVE 46%
*Complimentary New York Times access for the 2nd year will be given after 12 months

Super Saver

₹3,900

2 Years

₹162/Month

Subscribe

Renews automatically, cancel anytime

Here’s what’s included in our digital subscription plans

Exclusive premium stories online

  • Over 30 premium stories daily, handpicked by our editors

Complimentary Access to The New York Times

  • News, Games, Cooking, Audio, Wirecutter & The Athletic

Business Standard Epaper

  • Digital replica of our daily newspaper — with options to read, save, and share

Curated Newsletters

  • Insights on markets, finance, politics, tech, and more delivered to your inbox

Market Analysis & Investment Insights

  • In-depth market analysis & insights with access to The Smart Investor

Archives

  • Repository of articles and publications dating back to 1997

Ad-free Reading

  • Uninterrupted reading experience with no advertisements

Seamless Access Across All Devices

  • Access Business Standard across devices — mobile, tablet, or PC, via web or app

Topics :Buzzing stocksChart ReadingNifty Bank indexMarket technicals

Next Story