In the past 11 sessions, the index has rallied 1,200 points. So, is the index on course to breeze past its 52-week high of 12,430.5? Here's what charts suggest.
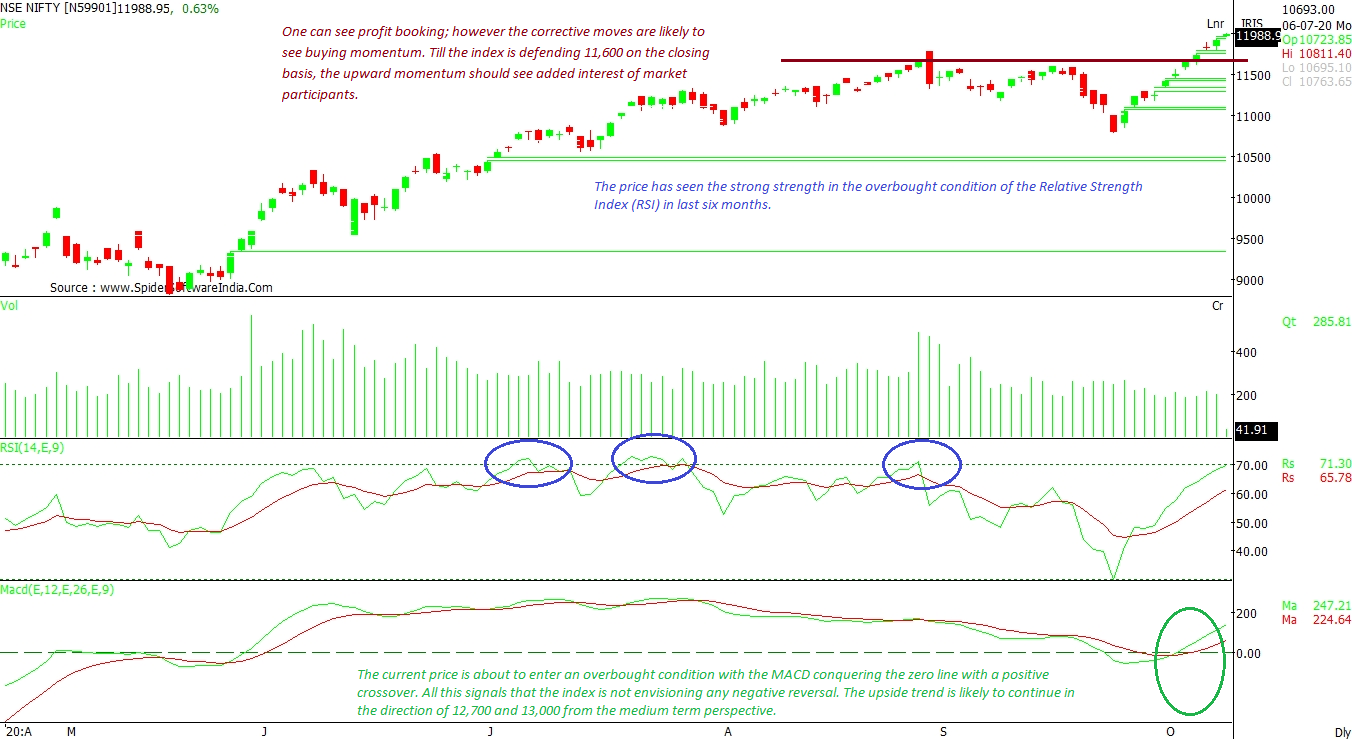
NIFTY50: The index has seen a good strength over the past few months. The Moving Average Convergence Divergence (MACD) should be able to conquer the zero line with a positive crossover. All this signals that the index is not likely to see a reversal soon. The upside trend is likely to continue in the direction of 12,700 and 13,000 from a medium-term perspective. That said, there can be intermittent corrections, which can see buying emerge at lower levels. Till the index is still defending 11,600 on the closing basis and has formed a base / support. The upward momentum should see added interest of market participants and volumes, too, should pick up.
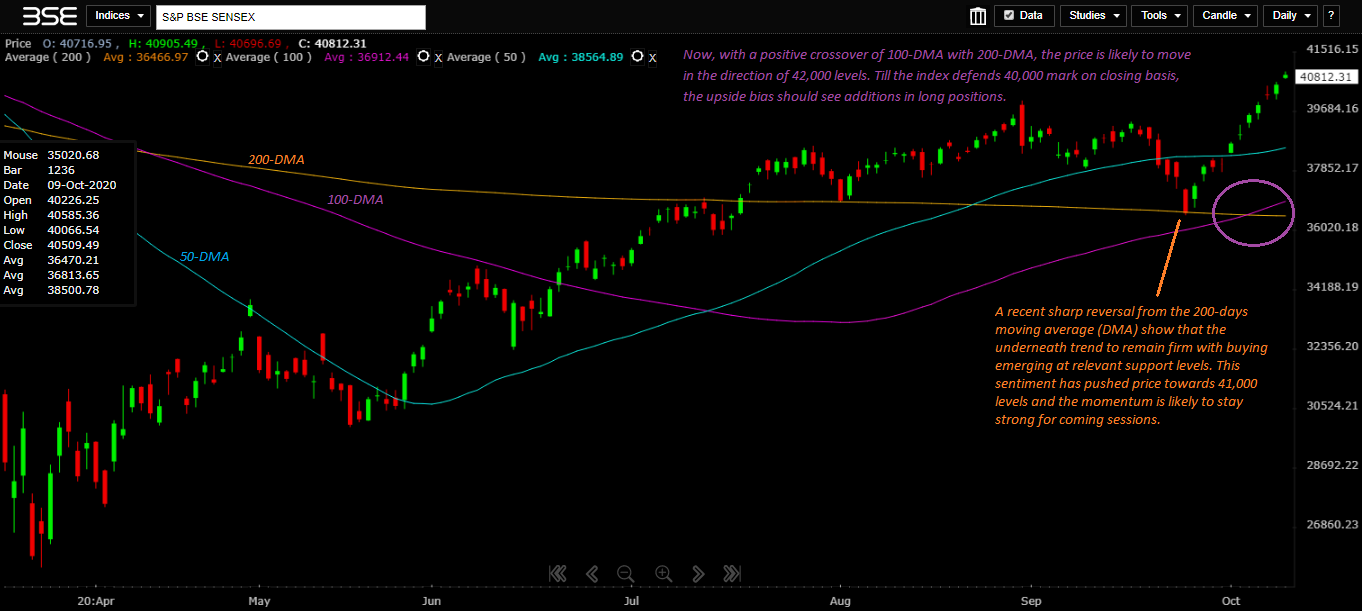
CLICK HERE FOR THE CHART S&P BSE SENSEX: A recent sharp reversal from the 200-days moving average (DMA) shows that the underlying trend remains firm with buying emerging at relevant support levels. This sentiment has pushed the index towards 41,000 levels and the momentum is likely to stay strong for the coming sessions. Now, with a positive crossover of 100-DMA with 200-DMA, the index is likely to move towards the 42,000 mark. Till the Sensex defends 40,000 mark on closing basis, the upside bias should see additions in long positions.
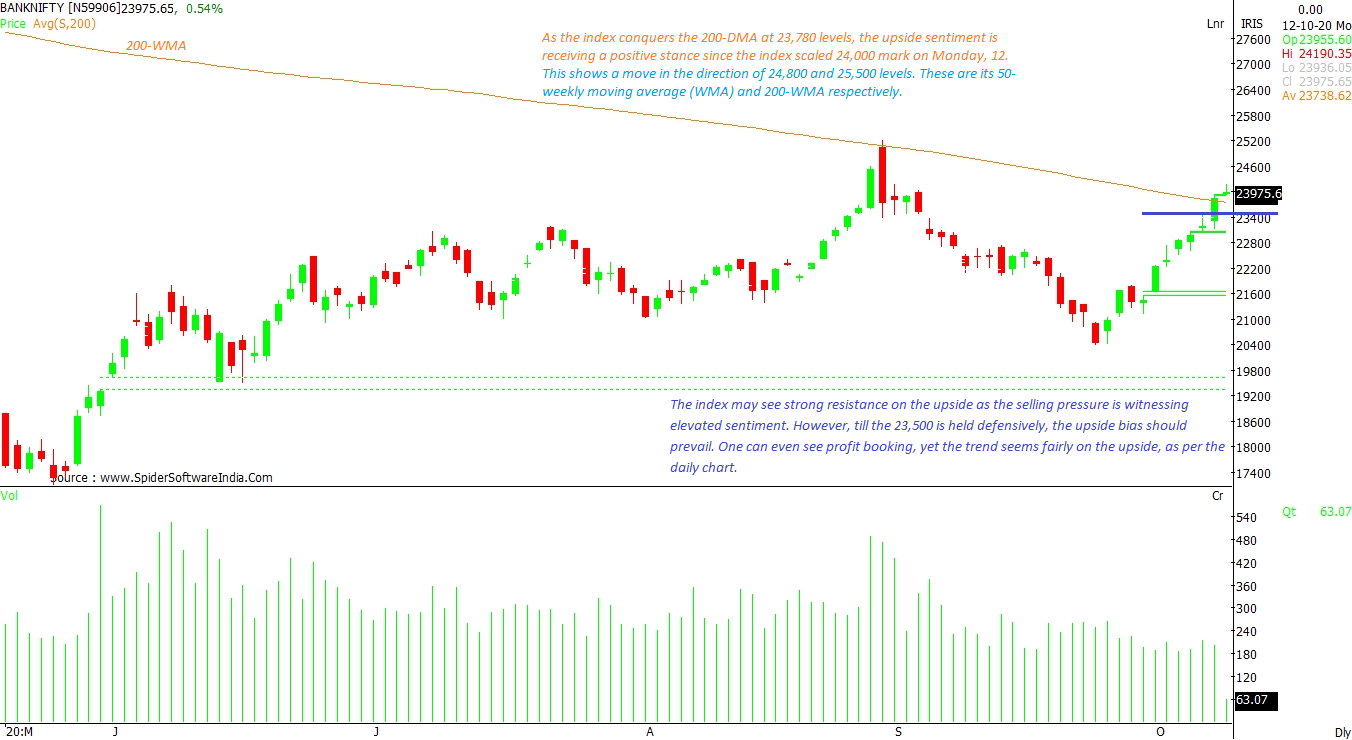
CLICK HERE FOR THE CHART NIFTYBANK: The index has seen a good run since the past few sessions. As it conquers the 200-DMA at 23,780 levels, the upside sentiment should sustain. After conquering the 24,000 level on Monday, Nifty Bank should move in the direction of 24,800 and then 25,500 levels. These are its 50-weekly moving average (WMA) and 200-WMA, respectively. The index may see strong resistance on the upside. However, till the 23,500 is held on a closing basis, the upside bias should prevail. One can even see profit booking intermittently, which should not be a cause for concern in the short-term.
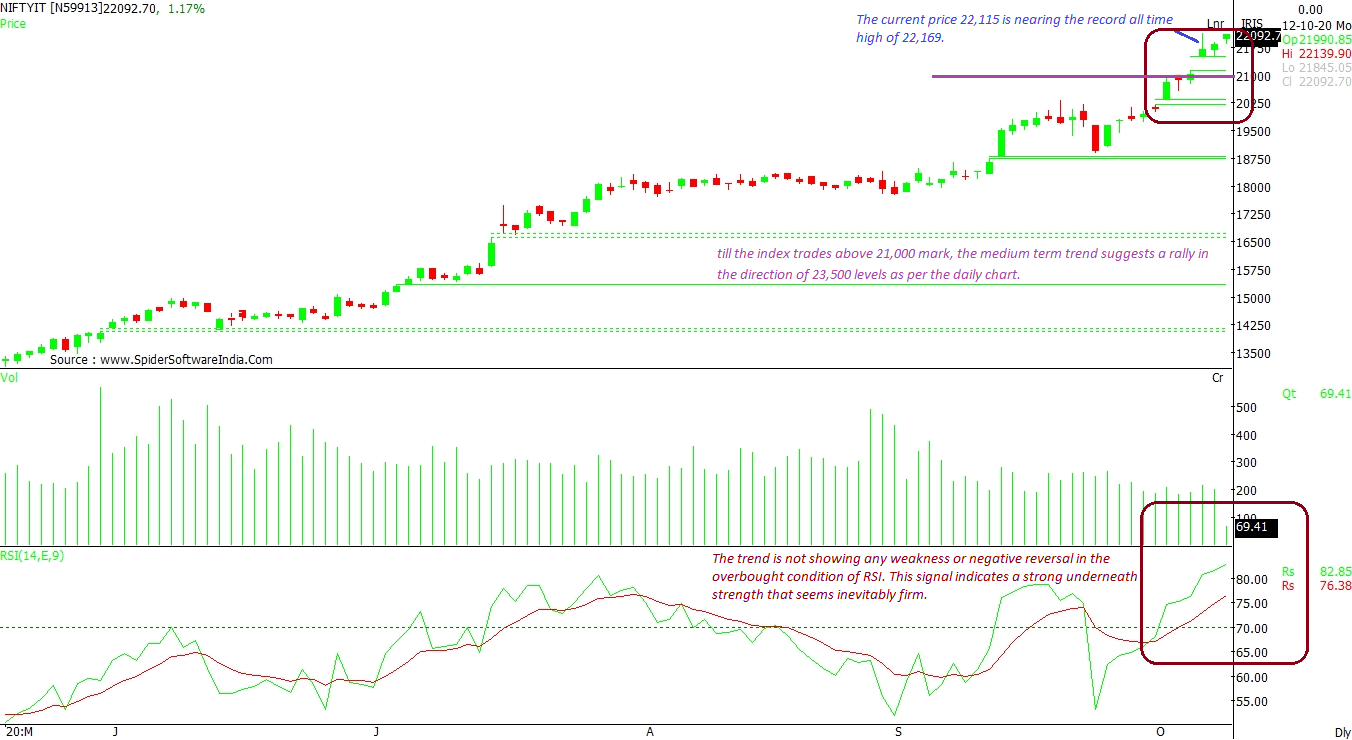
CLICK HERE FOR THE CHART NIFTY IT INDEX: The index at the current level of 22,115 is nearing the record all-time high of 22,169. Despite this, the overall trend remains firm. The RSI indicator is also supportive. Going forward, till the index trades above 21,000 mark, the medium-term trend suggests a rally in the direction of 23,500 levels, as per the daily chart.
CLICK HERE FOR THE CHART  "Is the Nifty on course to breeze past its 52-week high of 12,430.5?")


