Market outlook: Trade strategies for Sensex, Nifty during 21-day lockdown

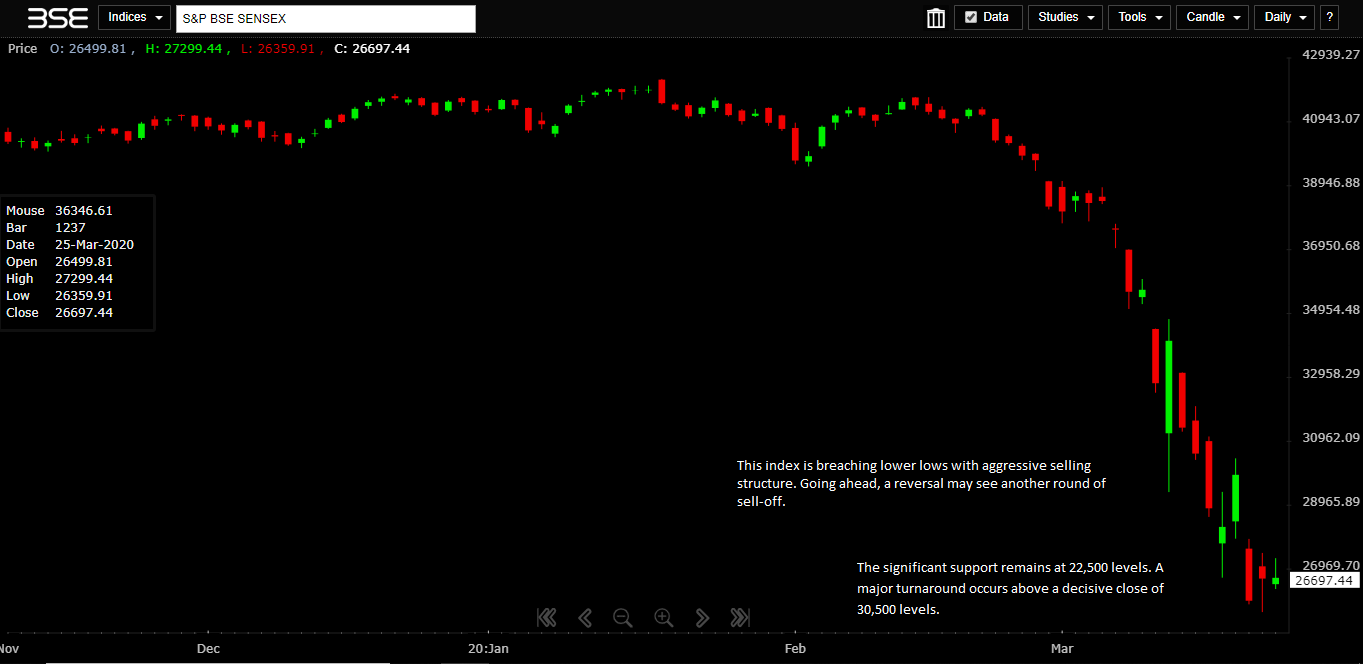
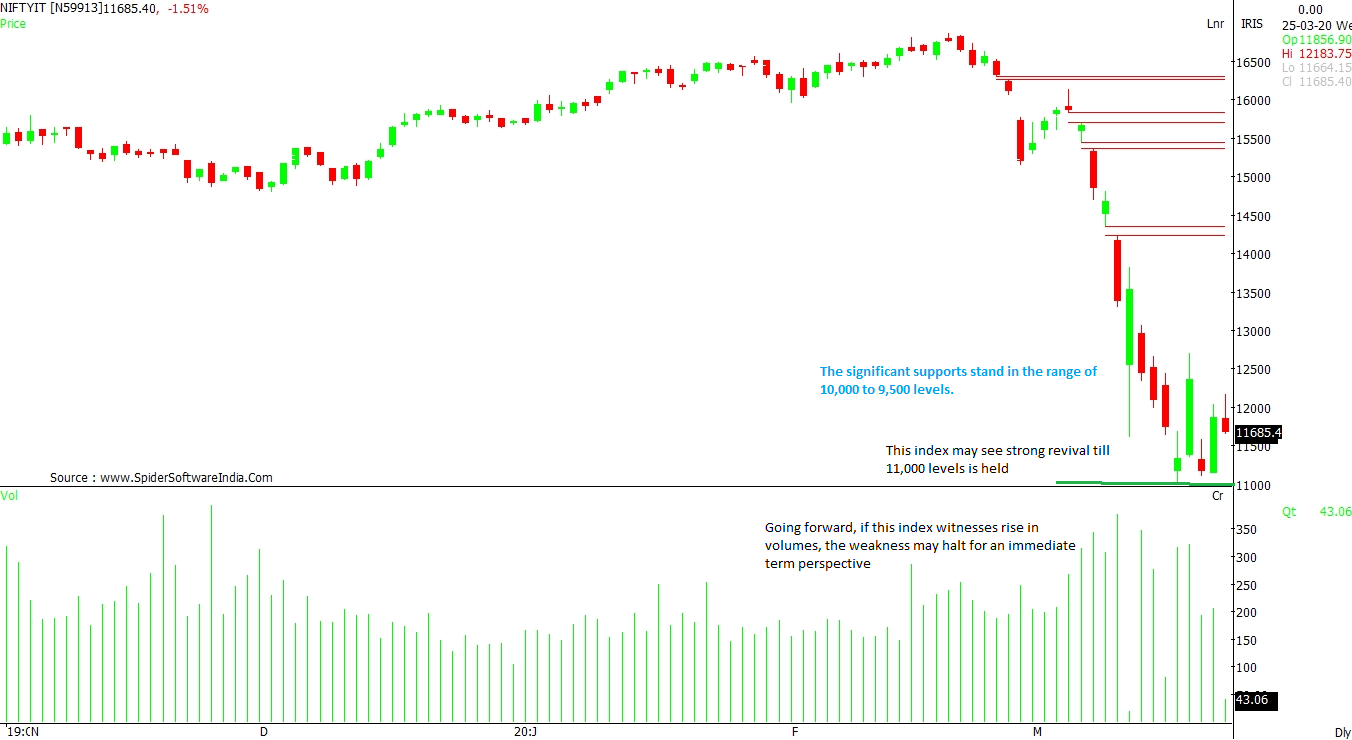
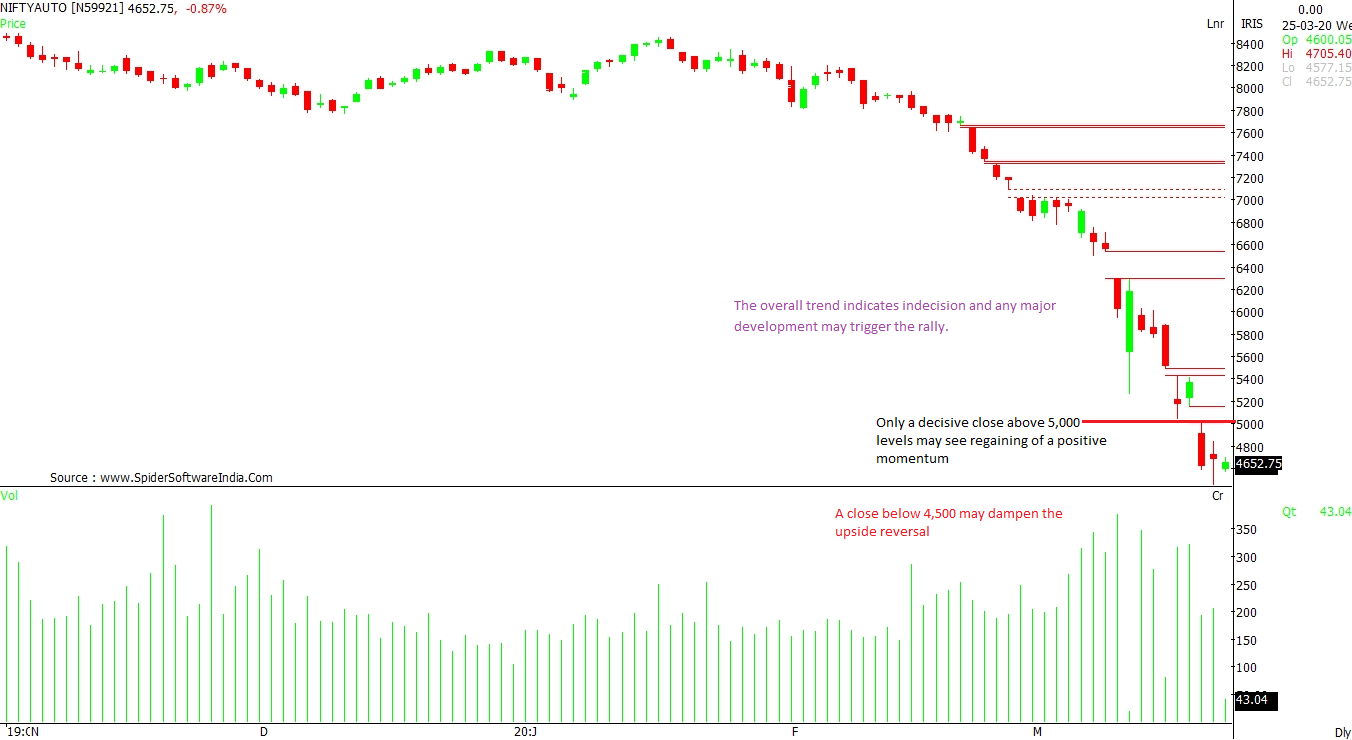
The reversal may see selling pressure at higher levels. However, the downside significant supports stand still in these corrective moves.

technicals
Avdhut Bagkar Mumbai
3 min read Last Updated : Mar 25 2020 | 11:42 AM IST
Prime Minister Narendra Modi on Tuesday announced a nationwide lockdown for 21 days as part of efforts to curb spread of COVID-19 pandemic. During this duration, all government and private establishments, apart from those involved in essential services, will be shut. However, the services of stock market entities will continue to remain open during the lockdown.

Referring to an order issued by Ministry of Home Affairs, Sebi said "the order... provides that commercial and private establishment shall be closed down but that the capital and debt market service as notified by the Securities and Exchange Board of India shall be exempted from such closures."

Here's how you can trade the major indices during this lockdown.

NIFTY 50: The recent fall in the index has broken all the major support levels. The sentiment has become bearish and volumes have started drying. That said, a bounce from the range of 7,800 – 7,500 levels cannot be ruled out. The next significant support comes at 6,500, addressing a medium-term prospect. The immediate supports are 7,300 and 6,900 levels. On the other hand, 9,000 becomes a strong resistance level. Just a close above the said level may induce positive sentiment. CLICK HERE FOR THE CHART

S&P BSE SENSEX:  The index is forming lower lows with aggressive selling structure. Going ahead, a reversal may find another round of sell-off. That said, the range of 26,500 – 25,500 may see some buying impulse emerge. But if this range also gets breached, then the next immediate support levels are 24,600 and 23,800. The significant support remains at 22,500 levels. A major turnaround occurs above a decisive close of 30,500 levels.  CLICK HERE FOR THE CHART

NIFTY BANK:  A breach of major support at 15,450 may see a sell-off, resulting in a rally towards the significant support of 13,200 levels. This index has fallen with bigger gap-downs, suggesting that the sentiment has deteriorated and may take a longer time to recover. The immediate support comes at 16,100 levels. On the other hand, 18,000 remains the major resistance level.  CLICK HERE FOR THE CHART
 
NIFTY IT: This index may see strong revival till 11,000 levels is held. A major rally is expected only above 12,500 levels as per daily chart. Significant supports stand in the range of 10,000 to 9,500 levels. The overall chart shows stable to upward bias. Going forward, if this index witnesses rise in volumes, the weakness may halt from an immediate-term perspective. CLICK HERE FOR THE CHART

NIFTY AUTO: Only a decisive close above 5,000 levels may see the index regaining a positive momentum. Till then, 4,740 and 4,870 levels remain the immediate resistance levels. A close below 4,500 may dampen the upside reversal. Support remains at 4,200 and 3,900 levels. The overall trend indicates indecision and any major development may trigger the rally.  CLICK HERE FOR THE CHART


One subscription. Two world-class reads.

Already subscribed? Log in

Subscribe to read the full story →
*Subscribe to Business Standard digital and get complimentary access to The New York Times

Smart Quarterly

₹900

3 Months

₹300/Month

SAVE 25%

Smart Essential

₹2,700

1 Year

₹225/Month

SAVE 46%
*Complimentary New York Times access for the 2nd year will be given after 12 months

Super Saver

₹3,900

2 Years

₹162/Month

Subscribe

Renews automatically, cancel anytime

Here’s what’s included in our digital subscription plans

Exclusive premium stories online

  • Over 30 premium stories daily, handpicked by our editors

Complimentary Access to The New York Times

  • News, Games, Cooking, Audio, Wirecutter & The Athletic

Business Standard Epaper

  • Digital replica of our daily newspaper — with options to read, save, and share

Curated Newsletters

  • Insights on markets, finance, politics, tech, and more delivered to your inbox

Market Analysis & Investment Insights

  • In-depth market analysis & insights with access to The Smart Investor

Archives

  • Repository of articles and publications dating back to 1997

Ad-free Reading

  • Uninterrupted reading experience with no advertisements

Seamless Access Across All Devices

  • Access Business Standard across devices — mobile, tablet, or PC, via web or app

Topics :technical analysisMarket technicalstechnical chartsDaily technicalstechnical callls

Next Story