So, how should you trade these stocks now? Is it a good time to exit given these developments? Here's what charts suggest.
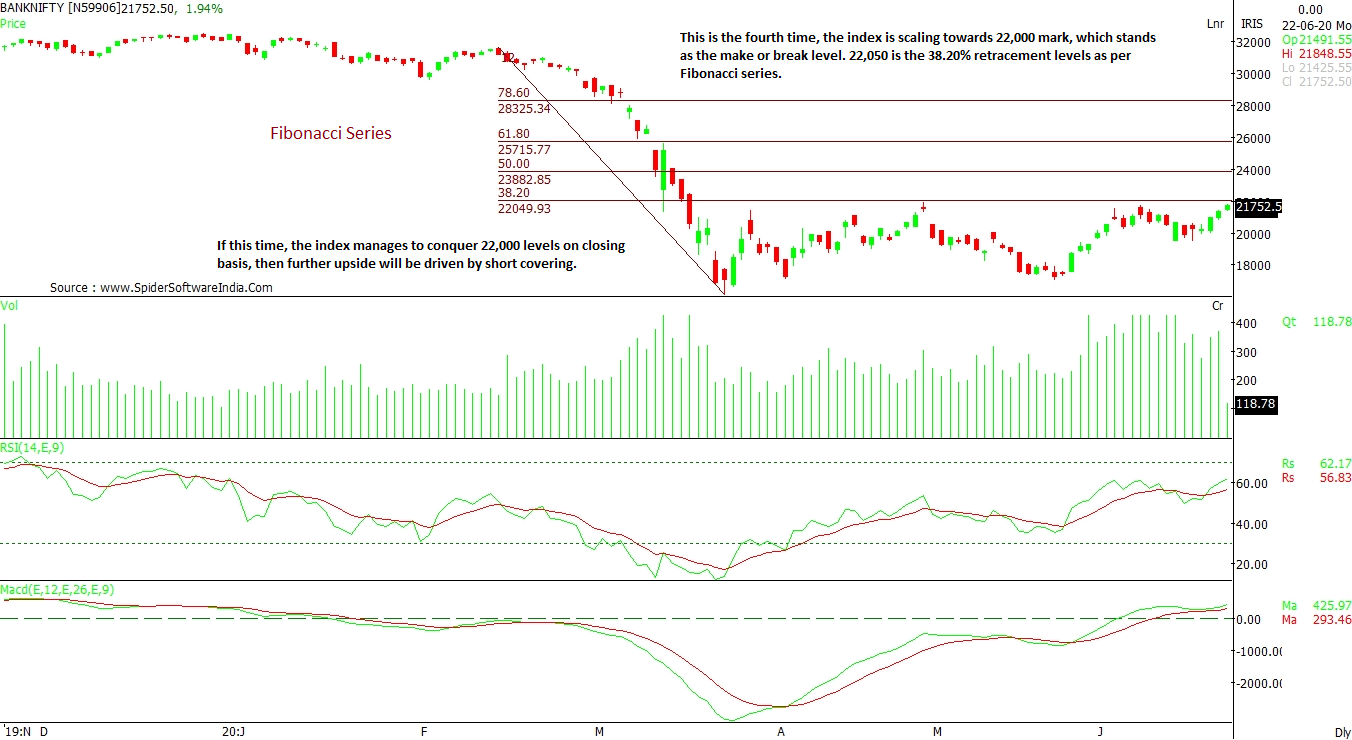
NIFTY BANK: This is the fourth time, the index has scaled towards the 22,000 mark, which is the make or break level. The 22,050 level is the 38.20% retracement level as per Fibonacci series. If this time the index manages to conquer 22,000 levels on a closing basis, further upside will then be driven by short covering. The volumes have remained modest; however, technical indicators like Relative Strength Index (RSI) and Moving Average Convergence Divergence (MACD) are indicating proactive moves. The support remains at 21,100 on closing basis.
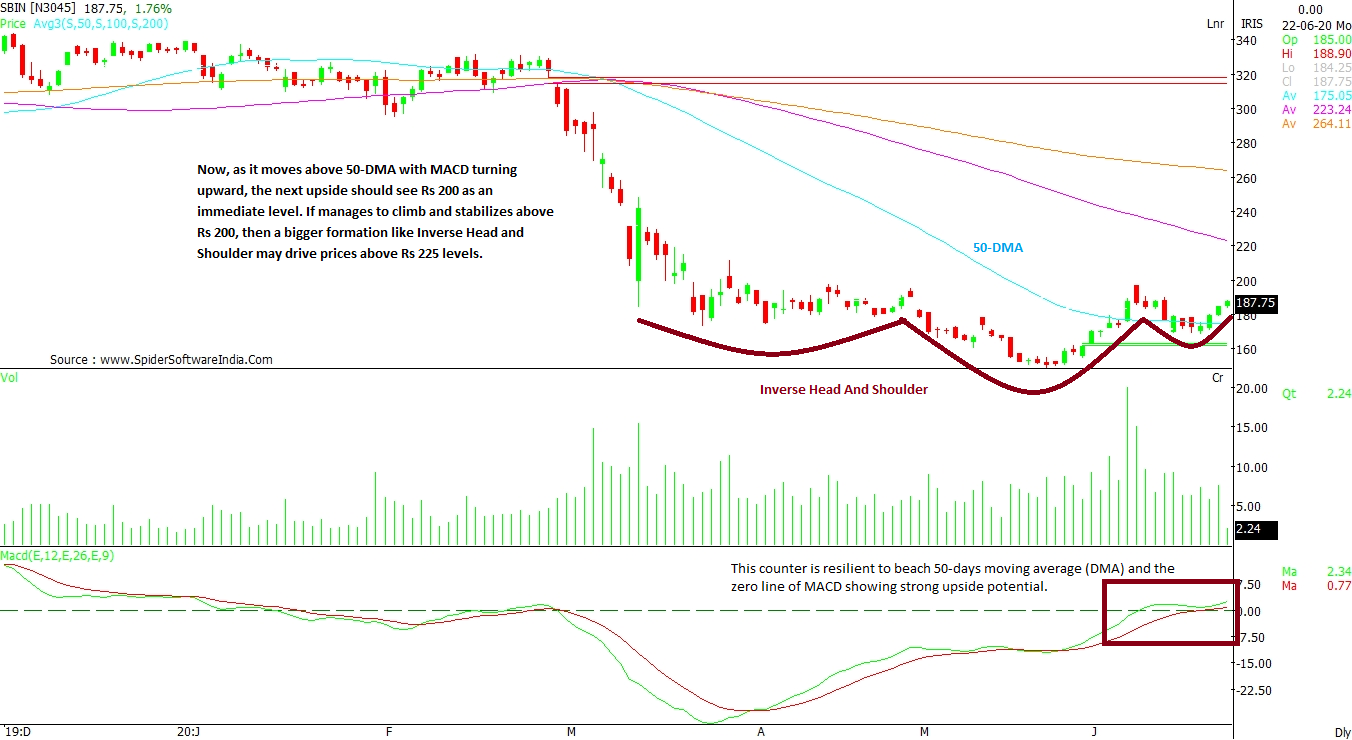
CLICK HERE FOR THE CHART State Bank of India (SBIN): This counter has been resisting to beach its 50-days moving average (DMA) and the zero line of MACD, which shows a strong upside potential. As the stock moves above the 50-DMA with MACD turning upward, the next upside should take it higher to Rs 200. If SBI manages to climb and stabilise above Rs 200, then a bigger formation (Inverse Head and Shoulder) may drive prices above Rs 225 levels.
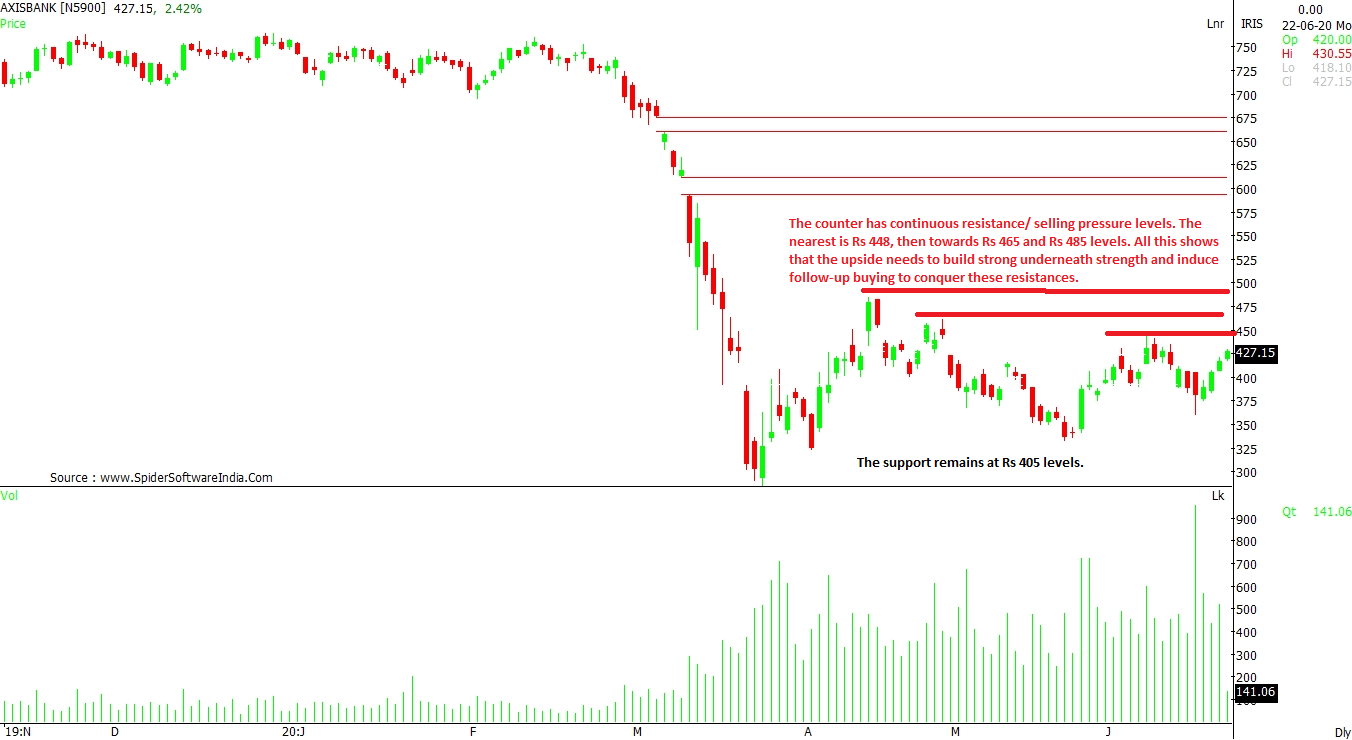
CLICK HERE FOR THE CHART Axis Bank Ltd (AXISBANK): The counter has faced continuous resistance / selling pressure levels at higher levels. The nearest resistence is at Rs 448, then towards Rs 465 and Rs 485 levels. All this shows that the upside needs to build strong underlying strength and induce follow-up buying to conquer these resistances. The support remains at Rs 405 levels. The overall trend remains positive, but needs more strength needs for the next leg of the next upside.
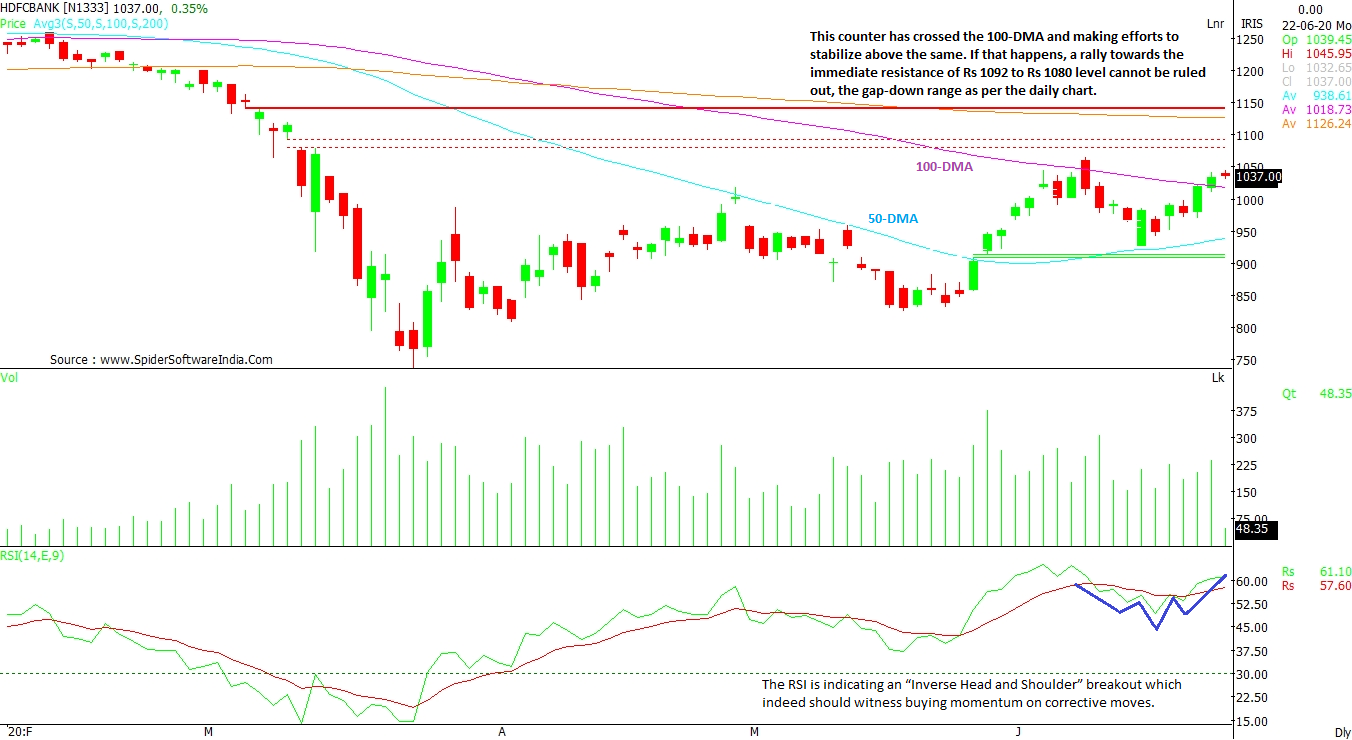
CLICK HERE FOR THE CHART HDFC Bank Ltd (HDFCBANK): This counter has crossed the 100-DMA and is making efforts to stabilise above the same. If that happens, a rally towards the immediate resistance of Rs 1092 to Rs 1080 level cannot be ruled out, which is the gap-down range as per the daily chart. The RSI is indicating an “Inverse Head and Shoulder” breakout, which indeed should witness buying momentum on corrective moves. The support remains at Rs 1,000 on closing basis.
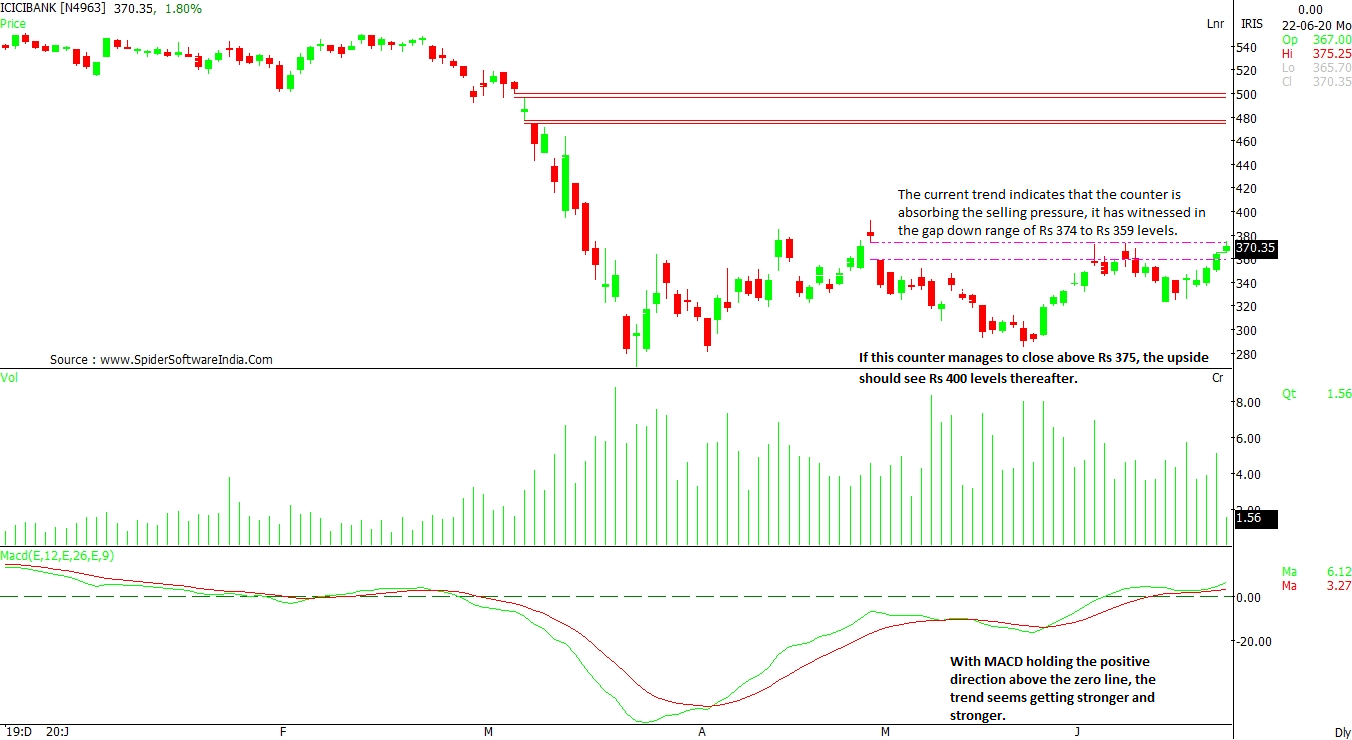
CLICK HERE FOR THE CHART ICICI Bank Ltd (ICICIBANK): The current trend indicates that the counter is absorbing the selling pressure witnessed in the gap down range of Rs 374 to Rs 359 levels. With MACD holding positive above the zero line, the positive trend should continue. If ICICI Bank manages to close above Rs 375, the upside can take the stock to Rs 400 levels.
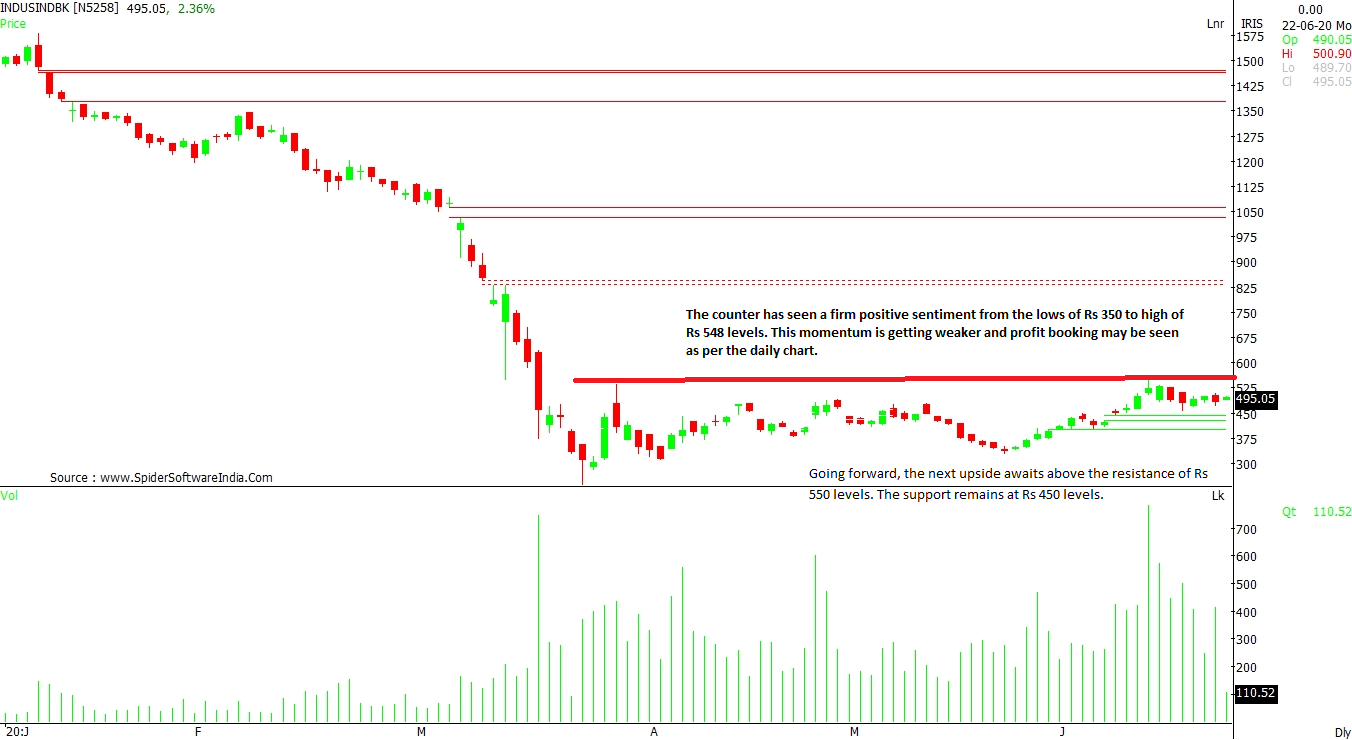
CLICK HERE FOR THE CHART IndusInd Bank Ltd (INDUSINDBK): The counter has seen a firm positive sentiment take the stock from the lows of Rs 350 to a high of Rs 548 levels over the past few weeks. However, this momentum is getting weaker and profit booking is visible as per the daily chart. Going forward, the next resistance is at Rs 550 levels. The support remains at Rs 450 levels.
CLICK HERE FOR THE CHART  "ICICI Bank, SBI: Fitch revises IDR outlook. Time to sell these stocks?")


