Indigo, Jet Airways, SpiceJet: Here's how they look on the technical charts

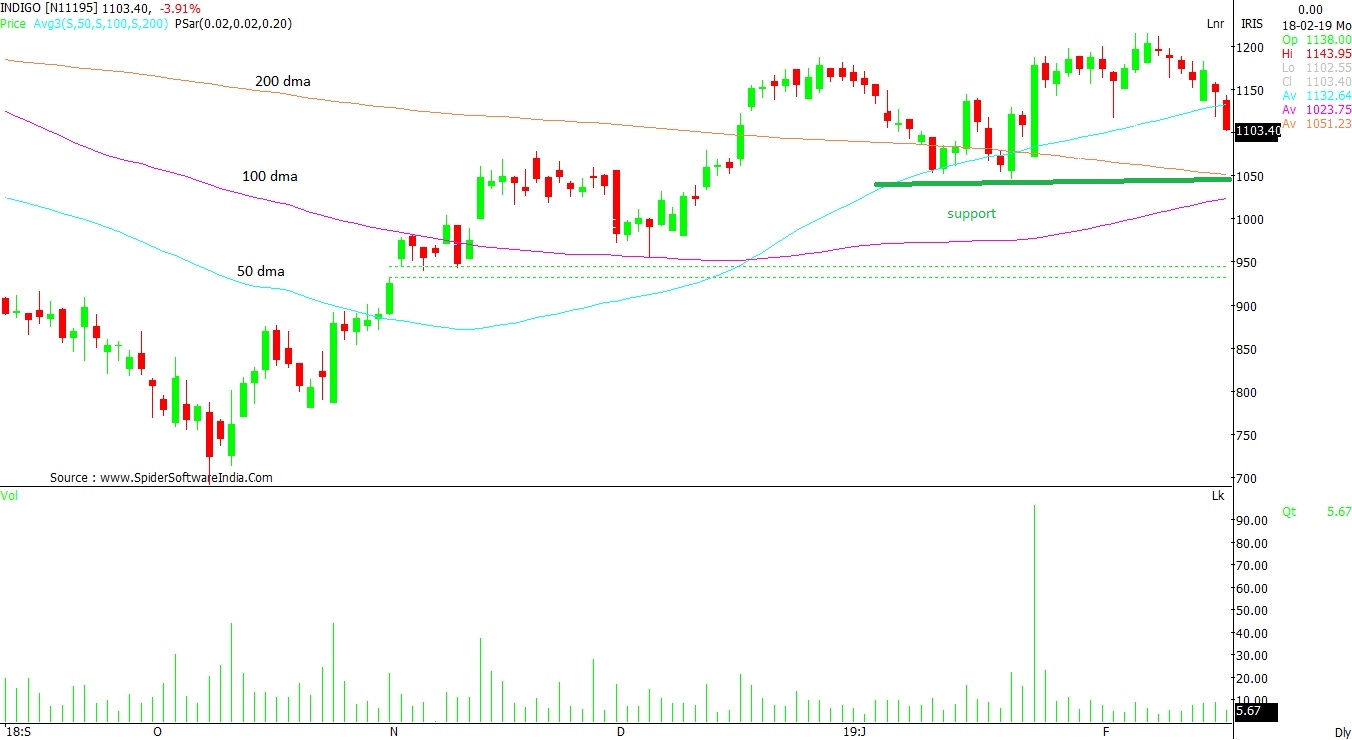
For Indigo, Rs 1,050 stays as strongest support for the counter and an immediate buying level at around Rs 1100, as per the chart

Indigo, Jet Airways, SpiceJet: Here’s how they look on the technical charts
Avdhut Bagkar Mumbai
Last Updated : Feb 18 2019 | 11:25 AM IST
Aviation stocks have been in the news recently. While cash-starved Jet Airways plans to raise about Rs 2,500 crore through a rights issue, IndiGo seems to be fighting a severe shortage of pilots. 

The budget carrier on Friday said scheduled cancellations of 30 flights every day would continue till March 31 and denied that 130 flights were being cancelled on Friday. IndiGo's statement came a day after media reports said the airline would cancel 130 flights on Friday.

Here's how the three leading aviation stocks look on the technical charts.

Indigo: The stock has performed well in recent times with a surge of 76 per cent in the last four months. The October low of Rs 691 last year with a recent high of Rs 1,217 indicates a strong positive sentiment for the stock.  The weekly chart shows “Higher high, higher lows” pattern indicative of a bullish trend. 


The level of Rs 1,050 stays as strongest support for the counter and an immediate buying level at around Rs 1100, as per the chart. The higher side resistance falls in the range Rs 1150 – Rs 1160 level. A breach can take the stock higher towards Rs 1210 levels.

Jet Airways: The stock has an immediate resistance at Rs 253 level, which also it its 50-day moving average (DMA) as per the daily chart pattern. The moving averages formation indicates a weak sentiment for the stock. However, it needs to stabilise above Rs 255 for a further upside in due course.


The MACD (moving average convergence and divergence) is in process of positive crossover below the zero-line, provided the stock scales newer highs. The near-term support comes at Rs 210 level with next support at Rs 200 level, as per the chart.

SpiceJet: The stock is consistently witnessing selling pressure at higher levels, the technical chart suggests. The scrip managed to scale above 200- DMA recently located around Rs 83, shifting the mood to positive sentiment. 


That said, the counter failed to move higher due to lack of follow-up buying and is gradually drifting lower towards its immediate support of Rs 72. The overall trend remains sluggish. A dip below Rs 65 can see buying come in from a medium-term perspective, monthly chart indicates.

One subscription. Two world-class reads.

Already subscribed? Log in

Subscribe to read the full story →
*Subscribe to Business Standard digital and get complimentary access to The New York Times

Smart Quarterly

₹900

3 Months

₹300/Month

SAVE 25%

Smart Essential

₹2,700

1 Year

₹225/Month

SAVE 46%
*Complimentary New York Times access for the 2nd year will be given after 12 months

Super Saver

₹3,900

2 Years

₹162/Month

Subscribe

Renews automatically, cancel anytime

Here’s what’s included in our digital subscription plans

Exclusive premium stories online

  • Over 30 premium stories daily, handpicked by our editors

Complimentary Access to The New York Times

  • News, Games, Cooking, Audio, Wirecutter & The Athletic

Business Standard Epaper

  • Digital replica of our daily newspaper — with options to read, save, and share

Curated Newsletters

  • Insights on markets, finance, politics, tech, and more delivered to your inbox

Market Analysis & Investment Insights

  • In-depth market analysis & insights with access to The Smart Investor

Archives

  • Repository of articles and publications dating back to 1997

Ad-free Reading

  • Uninterrupted reading experience with no advertisements

Seamless Access Across All Devices

  • Access Business Standard across devices — mobile, tablet, or PC, via web or app

Next Story