Auto stocks have remained subdued over the last one month. Hero MotoCorp, Mahindra & Mahindra (M&M), and Tata Motors have slipped in the range of 8-11 per cent while Maruti Suzuki India (MSIL) has shed 6 per cent. In comparison, the Nifty50 index has gained over 1 per cent whereas Nifty Auto index has declined over 4.50 per cent.
Here's a look at how Nifty Auto index and its key constituents have performed on tech charts -
NIFTYAUTO: The index managed to conquer 200-day moving average (DMA) and it further tried to scale "higher highs" but faced resistance around 8,500 levels. At the same time, the Relative Strength Index (RSI) witnessed selling pressure in the overbought region. As it slipped below the overbought condition making a negative crossover, the selling pressure got escalated resulting in a continuous price correction. CLICK HERE FOR THE CHART
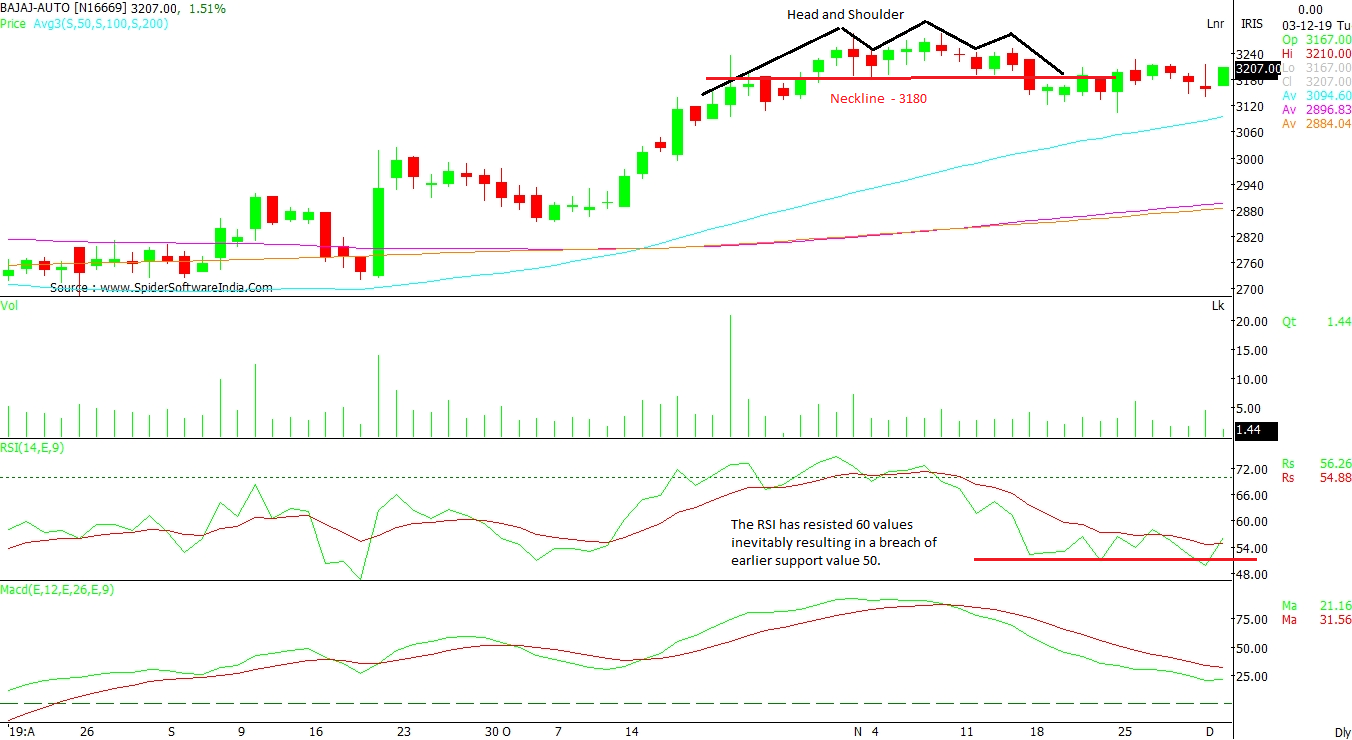
Bajaj Auto Ltd (BAJAJA-AUTO): The counter witnessed “Head and Shoulder” pattern on the daily chart as it closed below Rs 3,180. The formation was very narrow due to which the stock didn't see much correction. The RSI resisted 60 value which resulted in the breach of earlier support value of 50. The MACD traded in a negative crossover and was unable to rebound. CLICK HERE FOR THE CHART
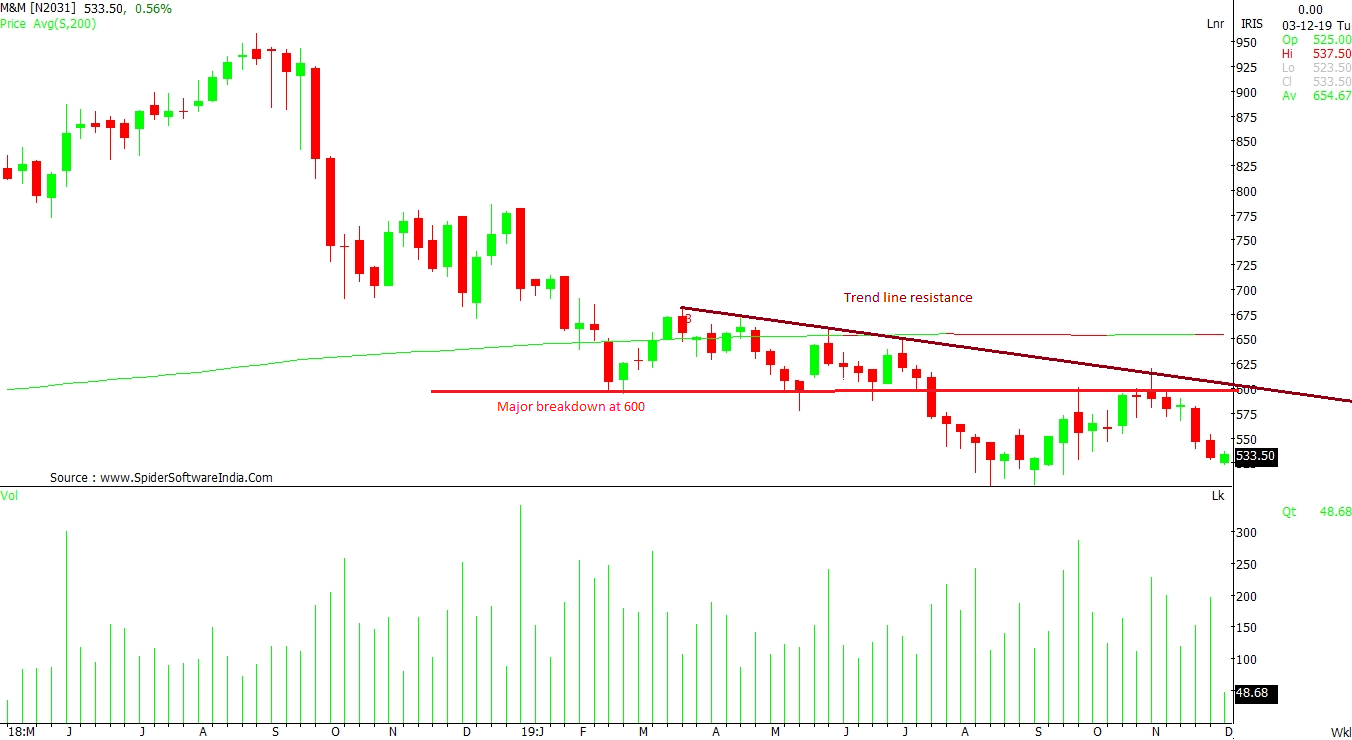
Mahindra & Mahindra Ltd (M&M): The stock made efforts to conquer the selling pressure but failed to do so, resulting in the breach of Rs 550. This situation coincided with the trend line resistance at Rs 600 level. The daily chart indicated that the counter faced strong resistance around its 200 DMA. Furthermore, a negative crossover of 100 DMA with 50 DMA dampened upside momentum. CLICK HERE FOR THE CHART
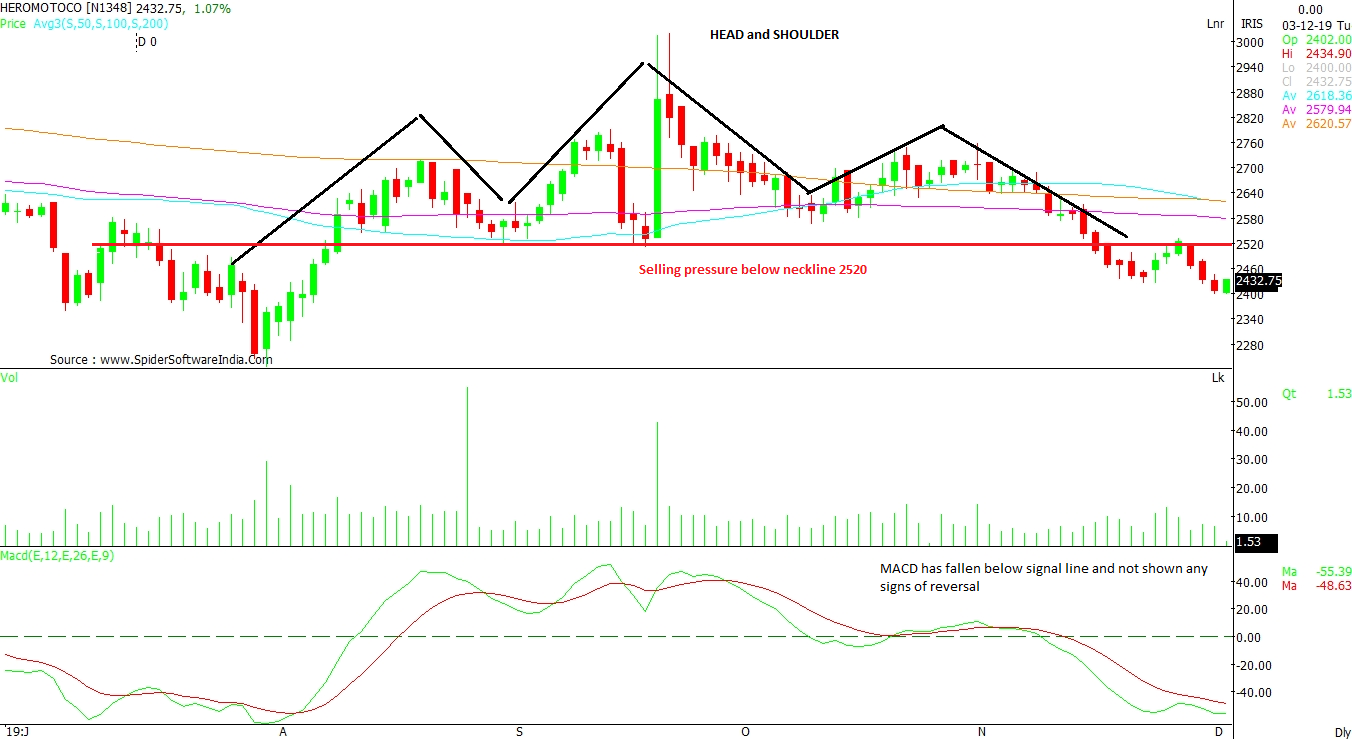
Hero MotoCorp Ltd (HEROMOTOCO): A detailed look showed that the counter could not sustain above 200 DMA and in the process of doing so, it formed "Head and Shoulder" pattern, which witnessed sell-off below Rs 2,520, as per the daily chart. MACD also slipped below the signal line.CLICK HERE FOR THE CHART
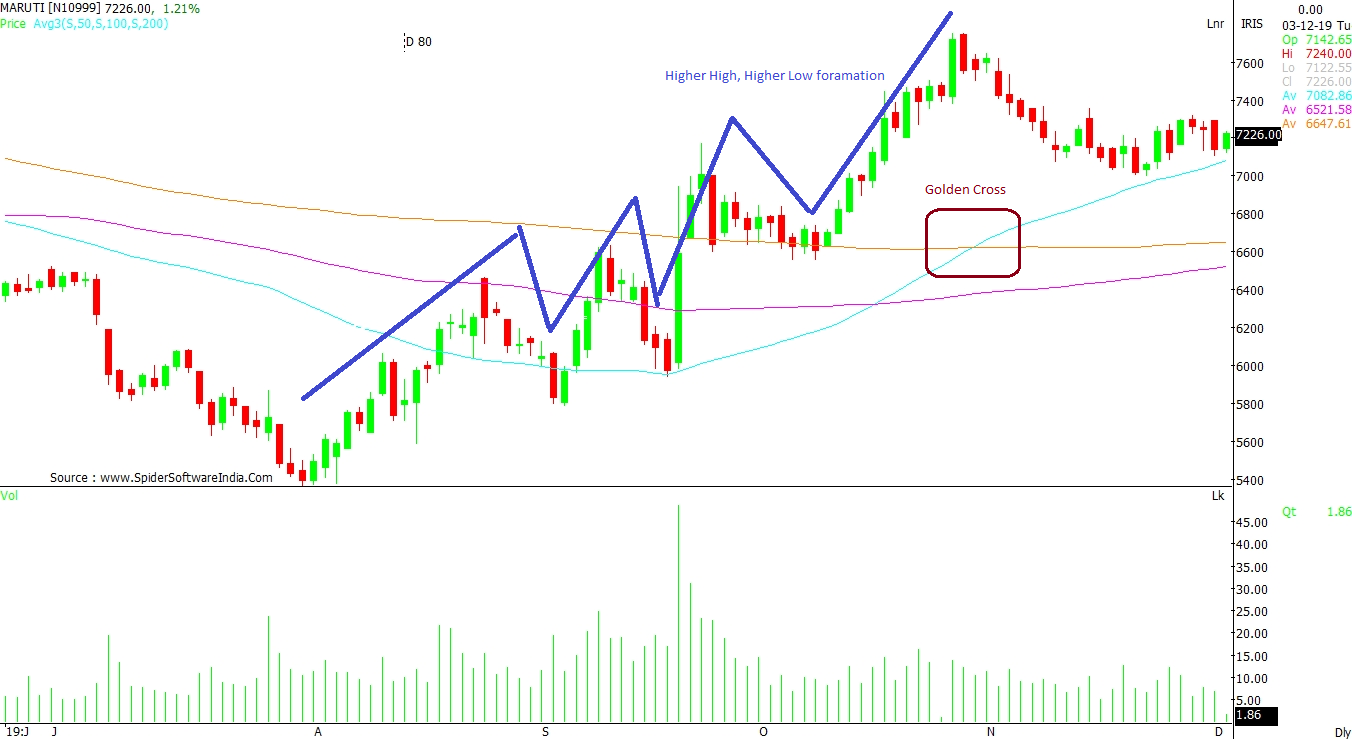
Maruti Suzuki India Ltd (MARUTI): After witnessing a "Golden Cross" formation at Rs 7,650 on the daily chart, the counter could not sustain the upward momentum because 100 Weighted Moving Average (WMA) at Rs 7,660 stood as a major hurdle. There was a support at Rs 7,000 which the counter managed to hold firmly. On the higher side, the counter failed to close decisively above Rs 7,350.CLICK HERE FOR THE CHART
Tata Motors Ltd (TATAMOTORS): The counter crossed 200 DMA with strong volumes; however, the price did not show any follow-up buying. Both the technical indicators, RSI and MACD traded with negative crossovers. During the last 15-20 sessions, volumes have remained sluggish. CLICK HERE FOR THE CHART
Read this article for free
Register to continue reading premium journalism and analysis from Business Standard.
 "Maruti, Tata Motors, M&M: How auto stocks have performed in last few weeks")


