4 min read Last Updated : Sep 10 2020 | 9:02 AM IST
Intra-day trading is tough. It demands the trader be on his/her toes all day long. Nevertheless, there are a few simple techniques one can employ while analysing a stock for intra-day trading.
To begin with, determining a trend is of utmost importance in intra-day trading. Entering a stock without considering the trend could lead to a heavy monetary loss and even affect the morale. Besides identifying volumes and moving averages, intra-day moves also need to be considered on the basis of favourable chart patterns. One should build his/her trading model after giving equal consideration to all these aspects.
Key chart Patterns
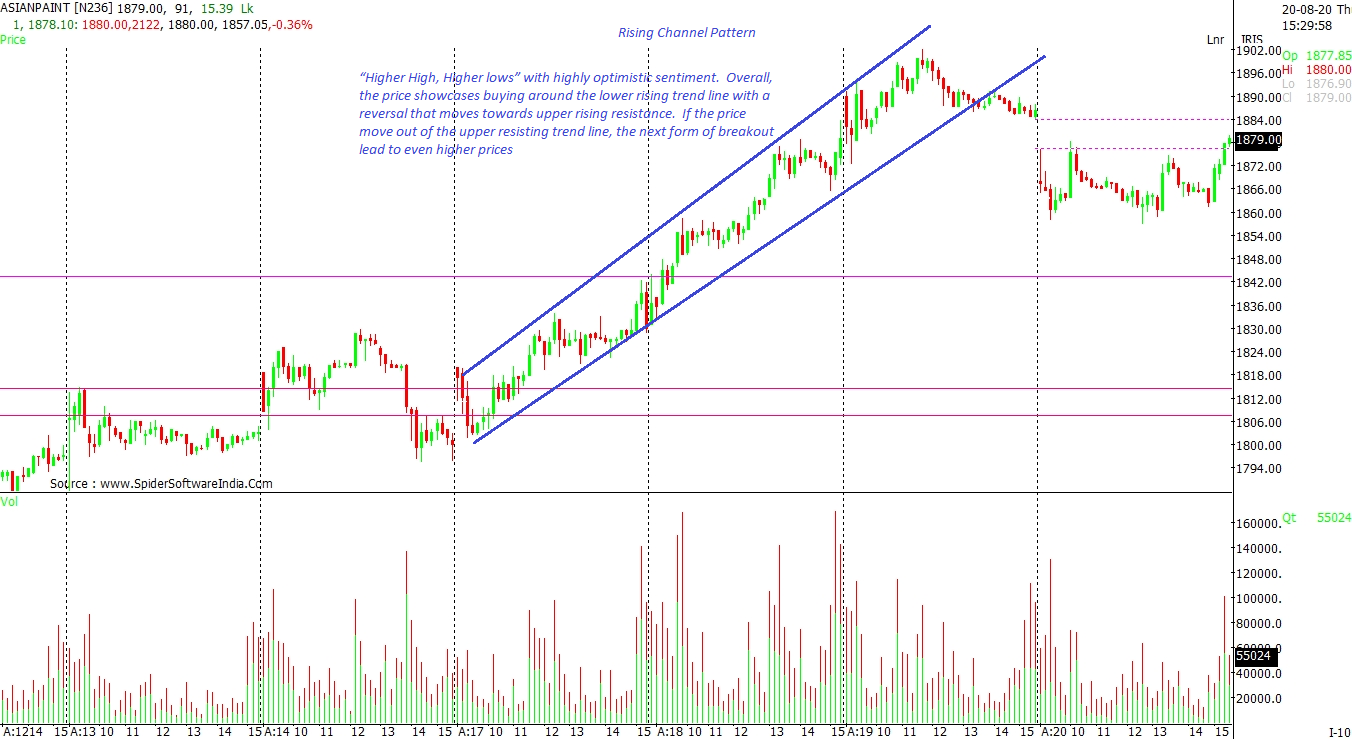
Chart patterns help one identify potential moves with the help of key support levels and certain predefined patterns. Chart patterns also eliminate the lag during sudden negative developments or in an abrupt market, allowing the trader to react faster. These chart patterns are categorised as: Continuation pattern, Reversal pattern, and Gap pattern.
1.Continuation Pattern
As the name suggests, these patterns signal the continuation of the ongoing trend, either upward or downward. The basic continuation patterns are 'Rising Channel Pattern' and 'Falling Channel Pattern'. If one spots either pattern, they can enter trades with respect to the breakout / breakdown levels.
Rising Channel Pattern
A rising channel pattern is an ascending channel with two upward rising trend lines acting as support and resistance. Herein, the price scales “Higher High, Higher lows” with highly optimistic sentiment. Overall, the price showcases buying around the lower rising trend line with a reversal that moves towards upper rising resistance. If the price breaches the upper resisting trend line, the next form of breakout leads to even higher prices. Similarly, if the price breaks the lower rising support, it demonstrates weakness in price with strong selling pressure. CLICK HERE TO VIEW CHART
Falling Channel Pattern
This is exactly the opposite of the 'Rising Channel Pattern'. It is a descending channel with falling trend lines. Either side's move outside the trend lines triggers the next rally. CLICK HERE TO VIEW CHART
2.Reversal Patterns
These structures represent a turnaround in the trend and acknowledges the bears gaining control. As a result, the stock can witness selling pressure. These patterns include: Head and Shoulder, Inverse Head and Shoulder, Double top, Double Bottom, Triple Top and Triple Bottom.
Among these, the major patterns on the buy side are Inverse Head and shoulder and Double Bottom. From the sell side perspective, Head and Shoulder and Double Top are reliable.
Head and Shoulder, Inverse Head and Shoulder
This formation involves two shoulders signifying two significant highs and a head that represents a level which the price couldn't breach. Whenever the price breaks the neckline -- the lower level of both shoulders -- the price is said to have attained a breakdown. This leads to accelerated selling pressure with price falling with a negative sentiment. Inverse Head and Shoulder is the opposite of Head and Shoulder. Herein, the price breaks out on a negative trend with buyers gaining on the upside. CLICK HERE TO VIEW CHART
Double Top, Bottom
A double top represents two distinct levels where the price witnessed selling pressure and overwhelming profit booking. Following this, the price starts exhibiting weakness, and, as it breaks the recent lows / reversal level, the selling pressure starts mounting, thereby leading to a complete breakdown. Double Bottom is exactly opposite of double top. Herein, the price breaks out on the upside with a strong positive sentiment. CLICK HERE TO VIEW CHART
3.Gaps
A Gap is a scenario wherein the price jumps from one level to another without any trading in between. There are various types of Gaps in technical analysis. This includes Breakaway Gaps, Exhaustion Gap, Common Gaps, and Continuation gaps. The widely seen are Breakaway and Exhaustion gap, but if one comes across Continuation gaps, the opportunity to ride the trend delivers quick returns. CLICK HERE TO VIEW CHART
On an intra-day scale, a gap-up opening as a breakaway gap attracts buyers who want to catch a moving trade. Similarly, a gap down reflects short sellers having the upper hand in a weak opening.