The Indian stock market remains one of the most expensive in the emerging world, adjusted for the expected pick-up in corporate earnings in the next 12-months.
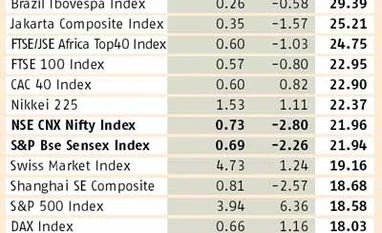
The bechmark Nifty is trading at a price to earning growth (PEG) ratio of 0.73, ahead of the indices of other emerging markets such as Brazil, Indonesia, Mexico, and South Africa. Only the Shanghai Composite Index is more expensive than Indian markets at a PEG ratio of 0.81. The S&P BSE Sensex is marginally cheaper at a PEG ratio of 0.69.
PEG ratio is calculated by dividing current price-to-earnings (P/E) ratio (22x in case of Nifty) by the expected growth in earnings per share in the next 12 months.
According to Bloomberg consensus estimates, the combined earnings (net profits) of Nifty companies are expected to grow 30.1 per cent in the next 12 months from the current level. During this period, the Sensex's underlying earnings are likely to grow 31.8 per cent.
In the past, the actual earnings growth in India has always been lower than initial estimates. For example, at the start of the previous financial year, market participants had expected the Sensex's earnings per share (EPS) for FY15 to grow 16.3 per cent over FY14. This turned out to be a wishful thinking and the Sensex EPS actually declined 9.7 per cent on a year-on-year (y-o-y) basis in FY15. And this is true for the previous years as well.
If a similar thing happens in FY16, the Street might look even more expensive. "Every year since FY09, consensus estimates for Nifty EPS starts from a high number at the beginning of the financial year and is then revised downwards with each passing quarter," says Dhananjay Sinha, head of institutional research at Emkay Global Financial Services. His analysis is based on a study of Bloomberg's two-year forward estimates for Nifty EPS beginning FY06.
For example, Nifty's EPS was expected to be around Rs 500 at the end of March, according to the initial estimates in April in 2012. This was progressively revised downwards to Rs 475 by the middle of the previous year. In comparison, the Nifty's current EPS is now Rs 388.6, down 7.8 per cent on a year on year basis. Given the many moving parts and uncertainty in global markets in recent years, it has become difficult to predict earnings. As a result, the Street has gone wrong quite often.
Apart from uncertainties, there are questions over the sustainability of earnings, given the fact that even the so-called safe havens, such as information technology and pharma sector companies, are witnessing volatility, with some firms giving profit warnings recently.
The hopes of an early revival in earnings of India Inc, after the Narendra Modi government's coming to power, have also been belied. While the government has taken various steps to revive growth, there is still a lack of clarity on earnings growth given the stress in various sectors such as infrastructure, power, and steel. Even cement companies are feeling pressure. If the earnings fall short again, the valuations will look even more expensive.
Some experts, however, don't believe the Indian markets are expensive. "The earnings cycle in India has most probably botttomed out and profits could double or triple from the current depressed levels. Given this, current P/E ratios give a misleading picture of the valuation of Indian stocks," says Nitin Jain, president and chief executive officer, global asset and wealth management, at Edelweiss Capital.
He also points to the large valuation gap between top stocks and laggards that make up benchmark indices. "On one end of the spectrum, we have stocks such as Hindustan Unilever and Asian Paints that are trading at 40-50 P/Es. On the other, commodity stocks and government-owned banks get single-digit P/E. This has messed up index valuation ratios," Jain adds.
Indian companies typically have higher return on equity than their counterparts in other emerging markets, translating into premium valuation on Dalal Street.
On a trailing basis, the Street remains reasonably priced compared to other emerging markets with the exception of Shanghai, Hongkong Hang Seng, and South Korea. The benchmark BSE Sensex is currently trading at 21.9 times its trailing 12 months EPS. The NSE Nifty is a little more expensive at 22x its underlying trailing earnings. Among major markets, Mexico's IPC Index is the most expensive with trailing price-to-earnings multiple of 30.8x. It is followed by Brazil Ibovespa Index (29.4x), and Jakarta Composite Index (25.2x).
This is largely due to the fact that unlike India, these markets are dominated by commodity and energy producers and their profitability has fallen sharply in the past year. For example, Ibovespa EPS has halved in the past year and it is down 25 per cent in South Africa. In contrast, corporate earnings are far more stable in India.
 "Nifty more expensive than other emerging world indices")