Home / Markets / News / SBI, Syndicate Bank: Should you buy PSU banks ahead of Union Budget 2019?
SBI, Syndicate Bank: Should you buy PSU banks ahead of Union Budget 2019?
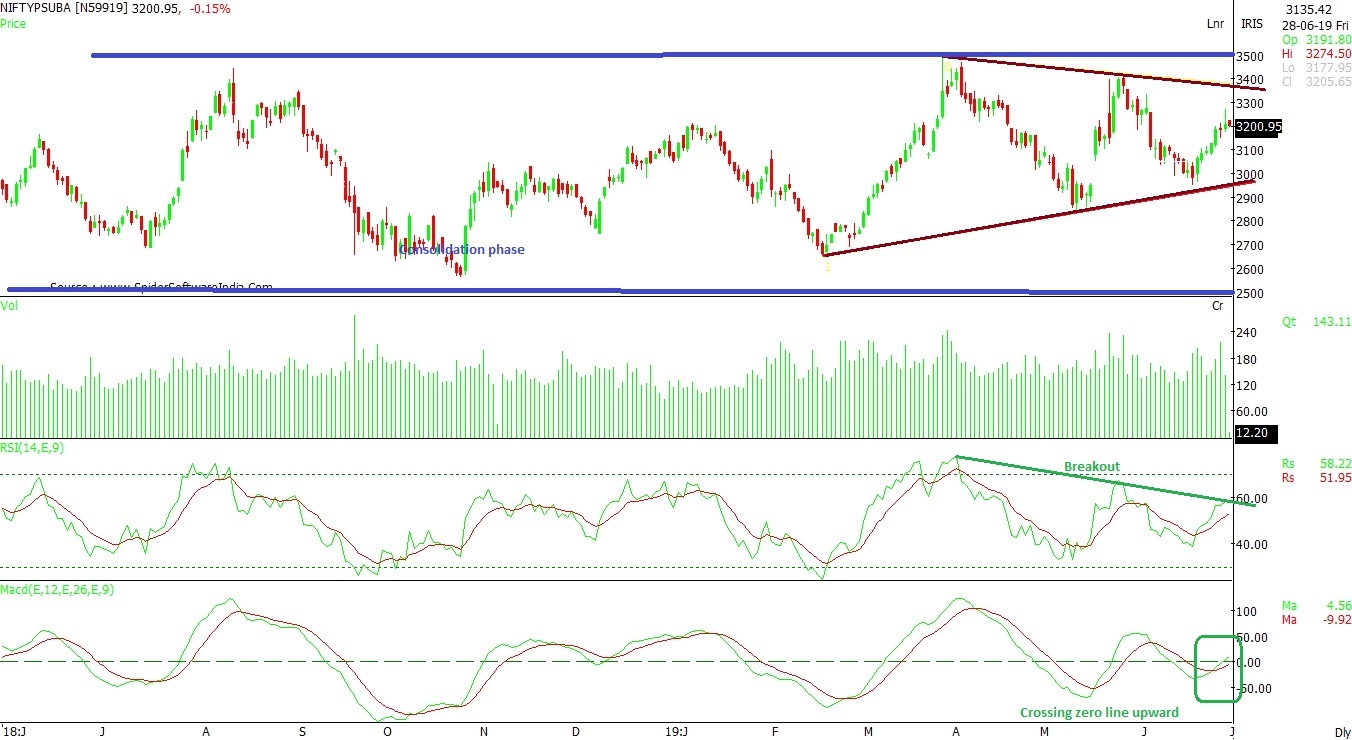
The Nifty PSU Bank chart depicts formation of 'symmetrical triangle', whose levels coincide with MACD breakout of 3,400-3,380. The support comes at 2,950 level
The past one year has been a consolidation phase for Nifty PSU Bank index in the range of 2,600. - 3,500 levels. Technical charts reveal formation of an 'Inverse Head and Shoulder' pattern that can result in a bigger upside only after a successful breakout. That said, the current trend seems positive and a rally towards 3,400 – 3,500 is in progress, as per the daily chart.
Diving deep into the technicals, the pattern does show a trend-line breakout on RSI (Relative Strength Index) - one that is scaling upward crossing 60 level. The MACD (Moving average convergence and divergence) is crossing zero line upward. This suggests that if the index is able to cross 3,400 level, then achieving a breakout level of 3,500 is likely.
The chart also depicts formation of 'symmetrical triangle', whose levels coincide with MACD breakout of 3,400-3,380. The support comes at 2,950 level. CLICK HERE FOR DETAILED CHART VIEW
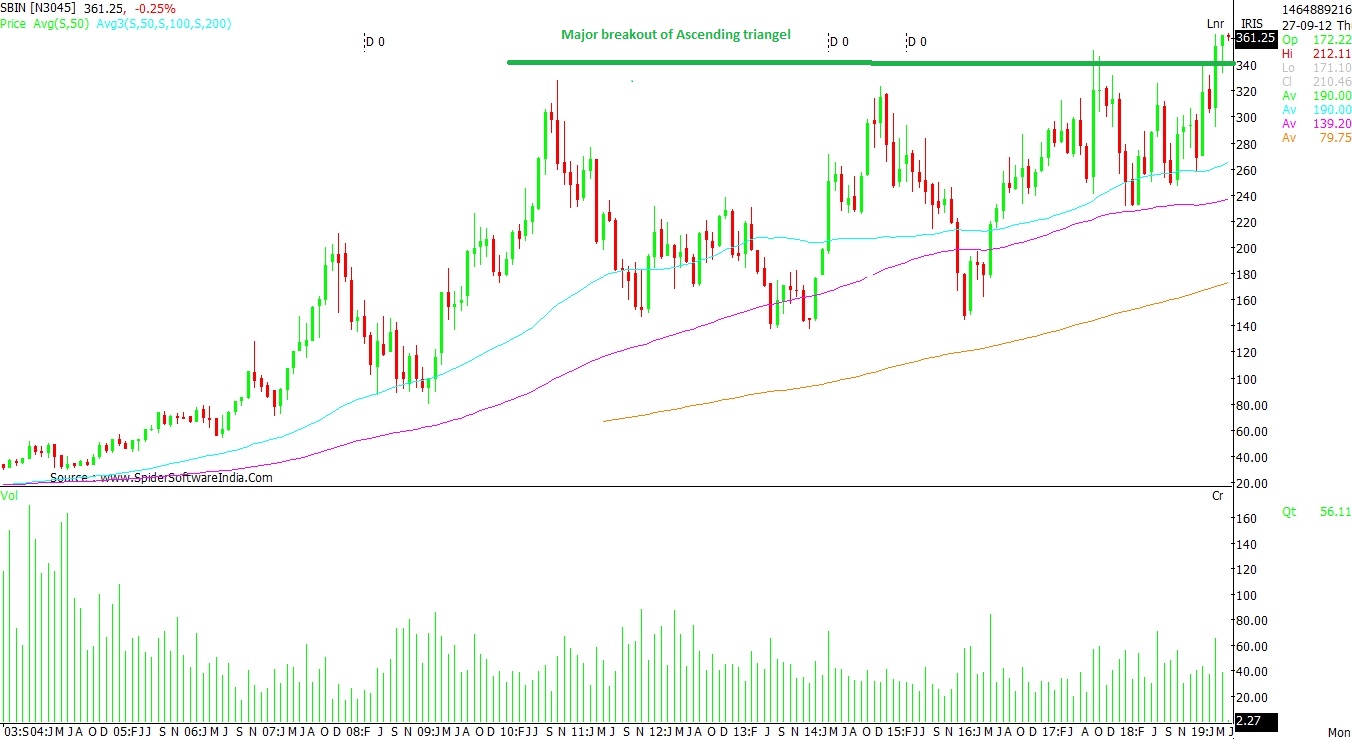
State Bank Of India (SBIN): The monthly chart displays a formation of an 'ascending triangle' with a breakout above the Rs 340 level. This stock is heading towards Rs 400 and Rs 440 in the near-term. As of now, the volumes show a decent rise, a higher level of participation may push this stock even higher. A healthy correction may be looked as buying opportunity, since Rs 311 stays as a strong support level, which is also its 100 days moving average (DMA) CLICK HERE FOR DETAILED CHART VIEW
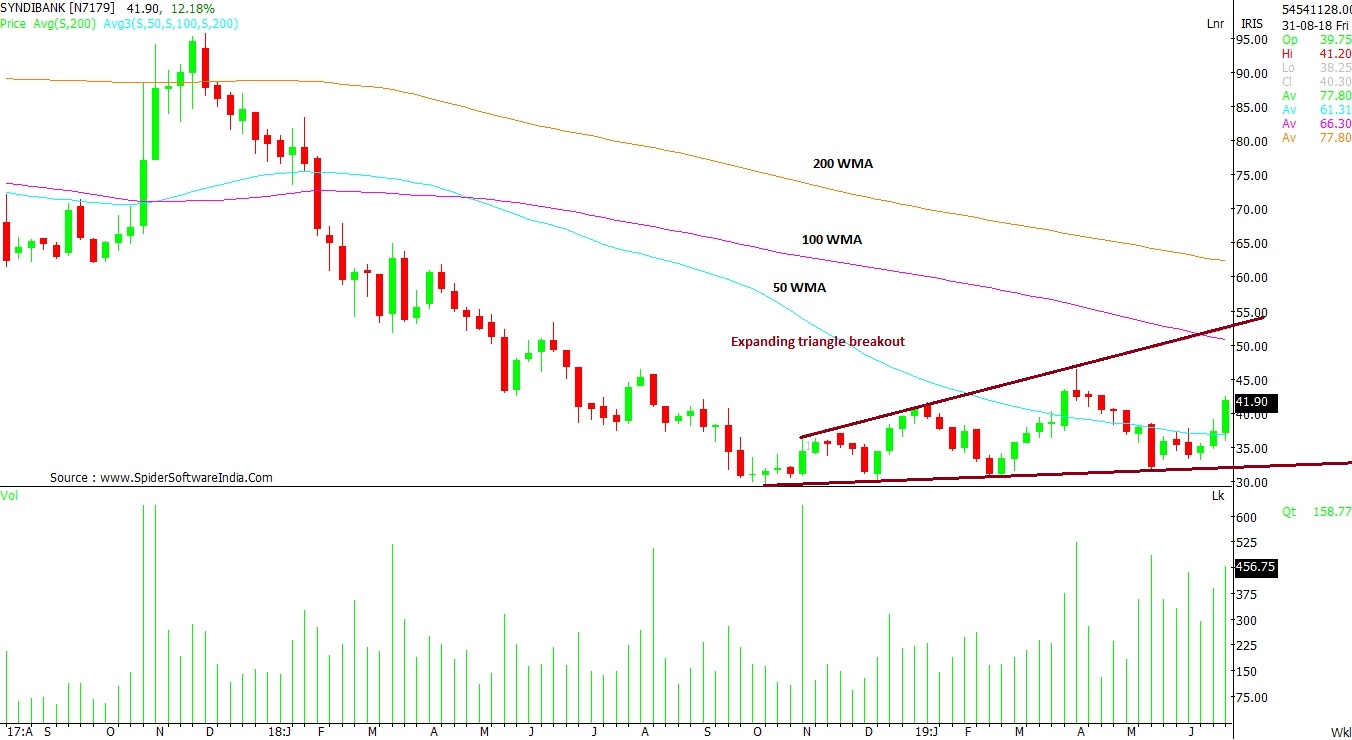
Syndicate Bank (SYNDIBANK): A formation of 'expanding triangle' on the weekly chart provides excellent opportunity for trading within both trendlines. This is a scenario where the stock holds the lower trendline support and resists at the upper trendline. At current levels, Rs 54 seems to be the resistance level for the counter with strong buying support at Rs 33. Trading with above-average volume further strengthens the upside move, suggesting that the positive rally is likely to continue. CLICK HERE FOR DETAILED CHART VIEW
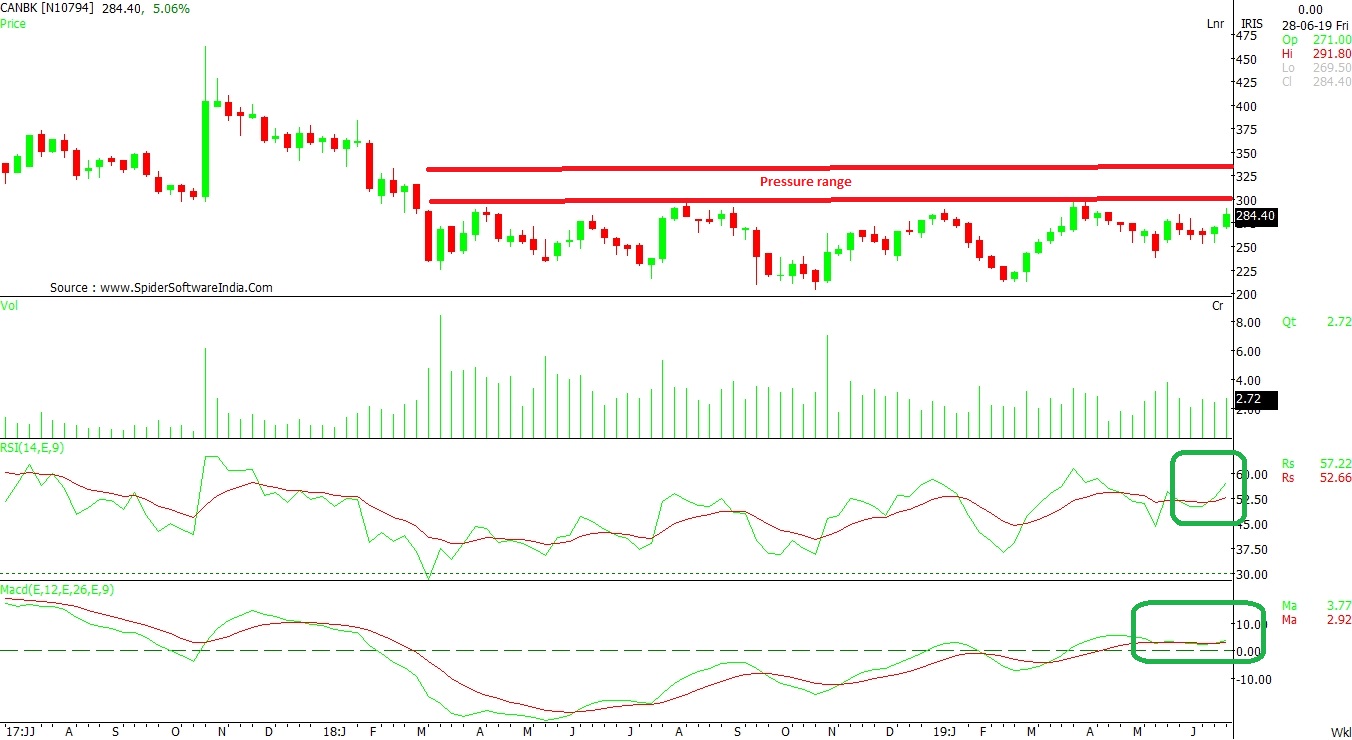
Canara Bank (CANBK):The pressure range of Rs 330 – Rs 300 will determine the next trend for this stock. The current trend shows a positive upside toward this range. Buying can be seen around Rs 270 level. If this level is breached successfully, then a rally towards Rs 400 is possible. As the stock is rising, all the major technical indicators are showing positive strength. The real test would when stock enters the pressure range. CLICK HERE FOR DETAILED CHART VIEW
Read this article for free
Register to continue reading premium journalism and analysis from Business Standard.
 "SBI, Syndicate Bank: Should you buy PSU banks ahead of Union Budget 2019?")


