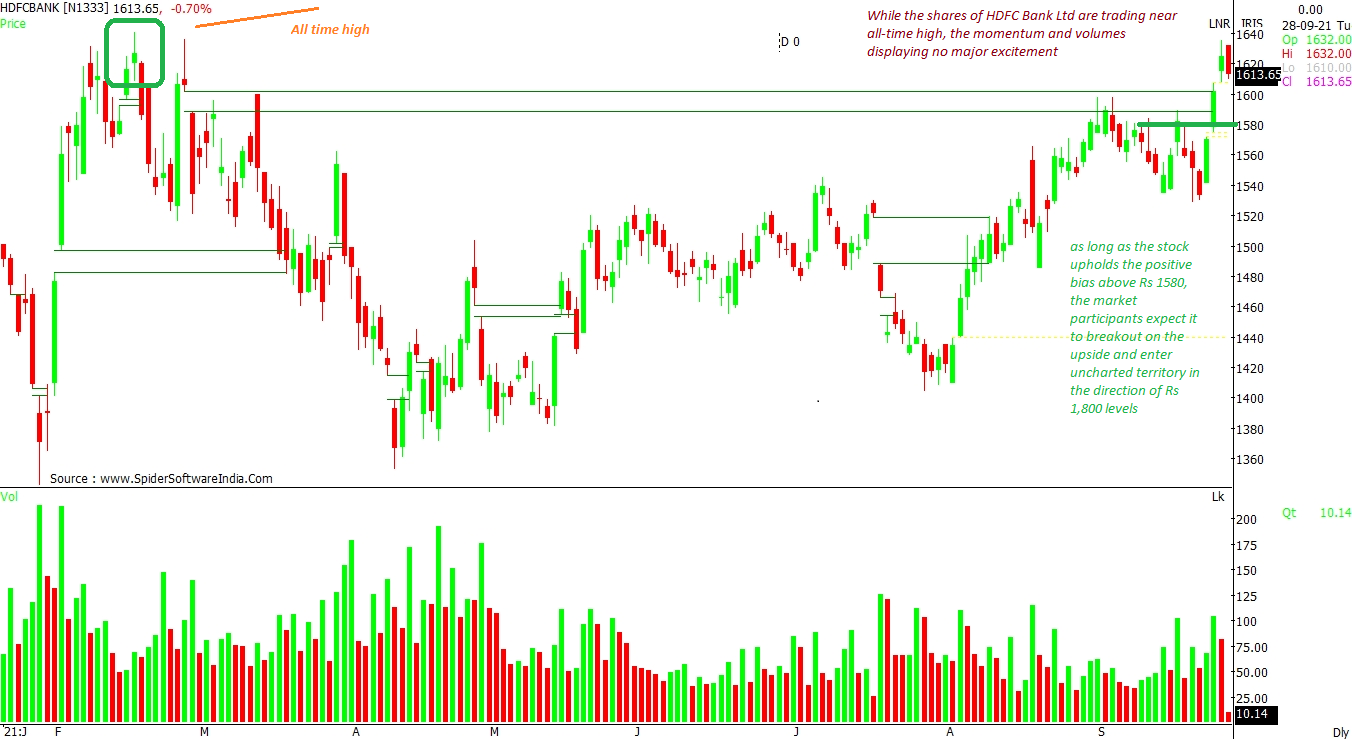
While the shares of HDFC Bank Ltd are trading near all-time high, the momentum and volume exhibits no major excitement. That said, as long as the stock upholds the positive bias above Rs 1,580, market participants can expect the stock to breakout on the upside and enter uncharted territory in the direction of Rs 1,800-odd levels, according to the daily chart. CLICK HERE FOR THE CHART
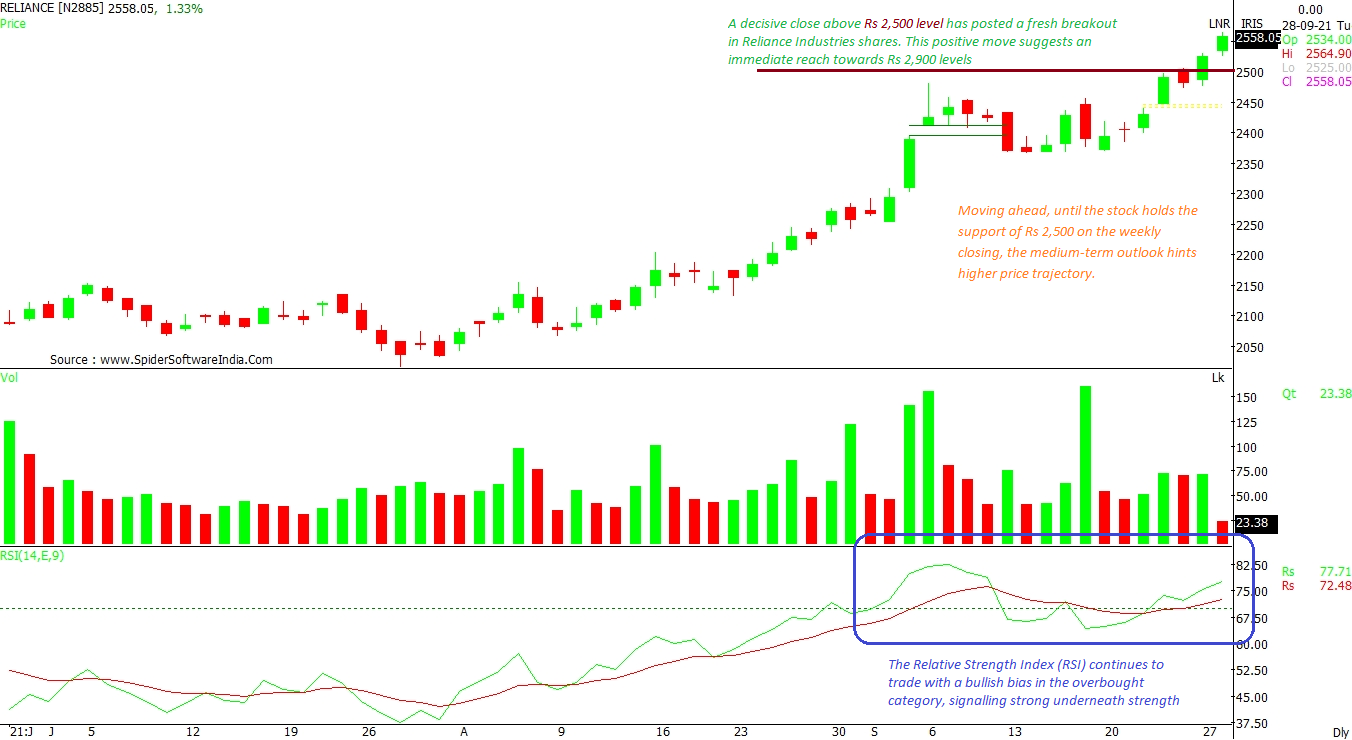
A decisive close above Rs 2,500-level has scripted a fresh breakout for Reliance Industries shares. This positive move indicates an immediate reach towards Rs 2,900 level, according to the weekly chart. The Relative Strength Index (RSI) continues to trade with a bullish bias in the overbought category, signalling strong underneath strength. Moving ahead, as long as the stock holds the support of Rs 2,500 on a weekly closing basis, the medium-term outlook hints higher price trajectory. CLICK HERE FOR THE CHART
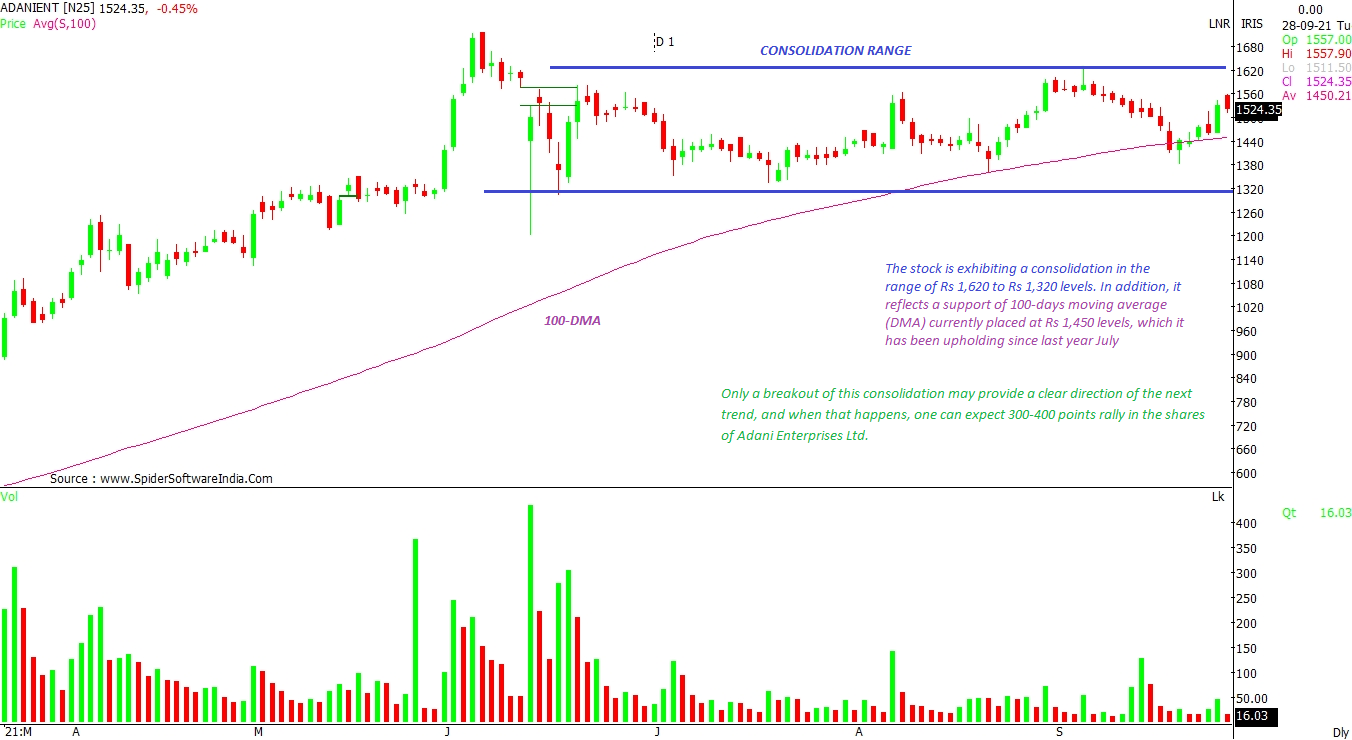
Adani Enterprises Ltd (ADANIENT)
Outlook: Consolidation
The stock is witnessing consolidation in the range of Rs 1,620 to Rs 1,320 levels. In addition, the stock also has good support around its 100-day moving average (DMA) currently placed at Rs 1,450, which it has been upholding since last year July. Only a breakout of this consolidation range, can provide a clear direction of the next trend, and when that happens, one can expect 300-400 points rally in the shares of Adani Enterprises Ltd. CLICK HERE FOR THE CHART
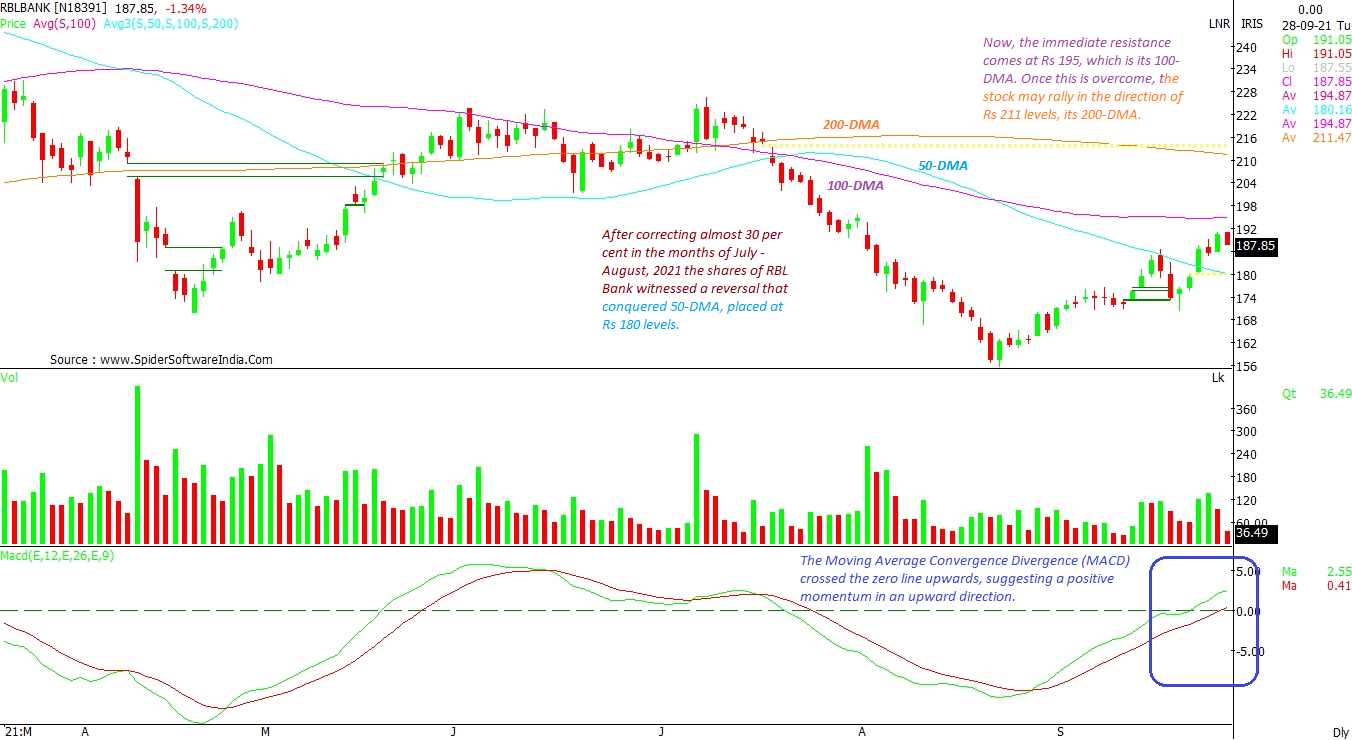
RBL Bank Ltd (RBLBANK)
Likely target: Rs 211 (after crossing 100-DMA)
Upside potential: 8%
After correcting almost 30 per cent in July - August, 2021 period, the shares of RBL Bank witnessed a reversal that conquered 50-DMA, placed at Rs 180 level. Now, the immediate resistance comes at Rs 195, which is its 100-DMA. Once this is overcome, the stock may rally in the direction of Rs 211-odd levels, its 200-DMA. The Moving Average Convergence Divergence (MACD) crossed the zero line upwards, suggesting a positive momentum in an upward direction. CLICK HERE FOR THE CHART
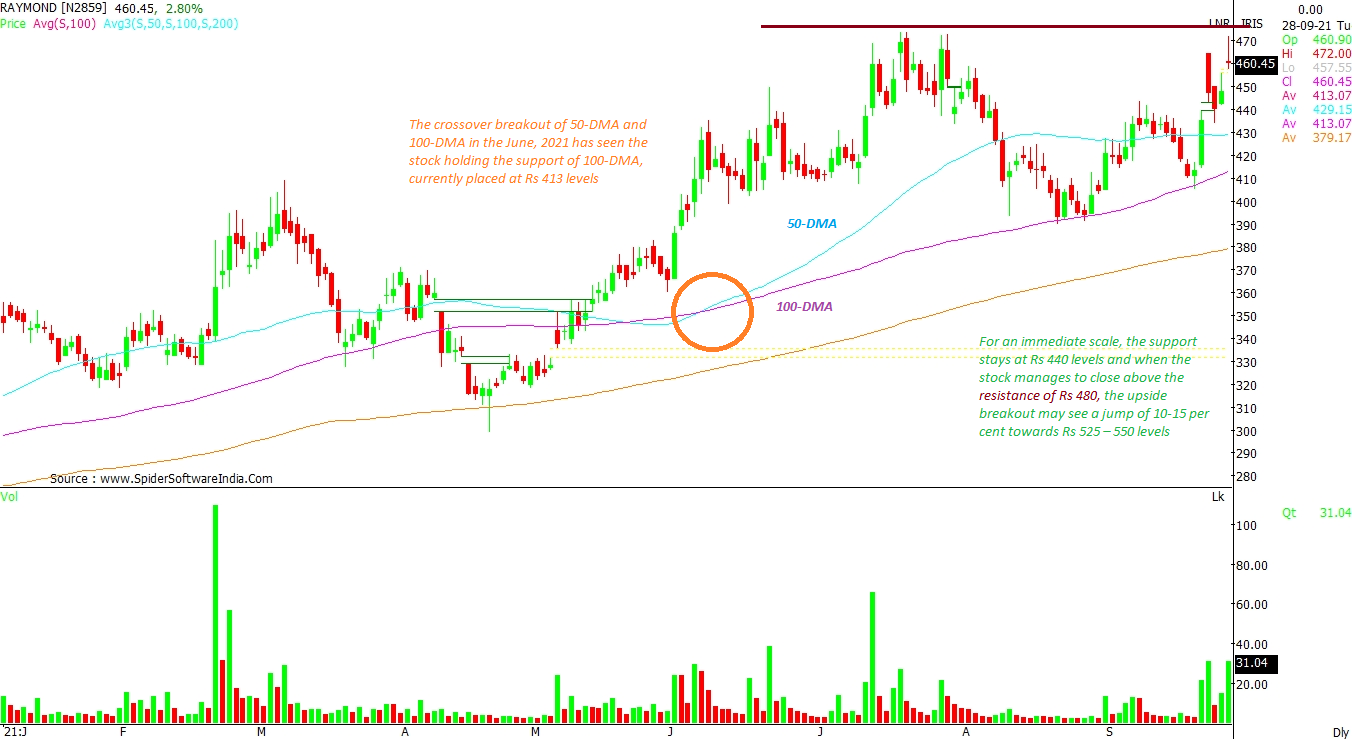
The crossover breakout of 50-DMA and 100-DMA in the June, 2021 has seen the stock holding the support of 100-DMA, currently placed at Rs 413. For an immediate scale, the support stays at Rs 440 levels and when the stock manages to close above the resistance of Rs 480, the upside breakout may see a jump of 10-15 per cent towards Rs 525 – 550 levels, according to the daily chart.CLICK HERE FOR THE CHART
Read this article for free
Register to continue reading premium journalism and analysis from Business Standard.
 "Raymond, RBL Bank: 5 buzzing stocks that can rally up to 15% from here")


