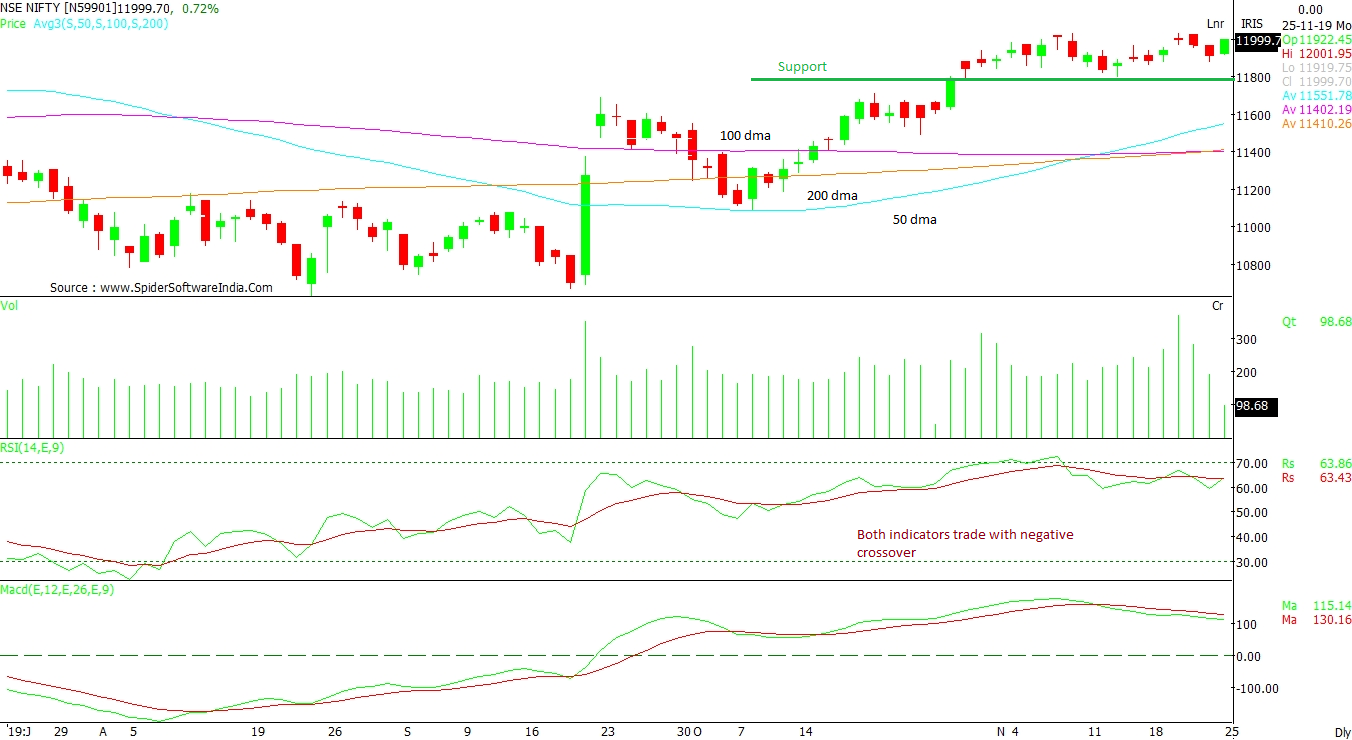
NIFTY 50: The index has formed 'Golden Cross' pattern on the technical charts and is set to rise towards lifetime high. That said, conquering the 12,000 mark on closing basis seems a difficult task as things stand. This level has become a stiff hurdle from the past 12 sessions. Indeed, the overall trend looks optimistic above 11,800, which is the immediate support. Only a sharp close below this level may trigger more correction. Although, Relative Strength Index (RSI) has fallen below oversold condition, it still trades with a negative crossover along with Moving Average Convergence Divergence (MACD).
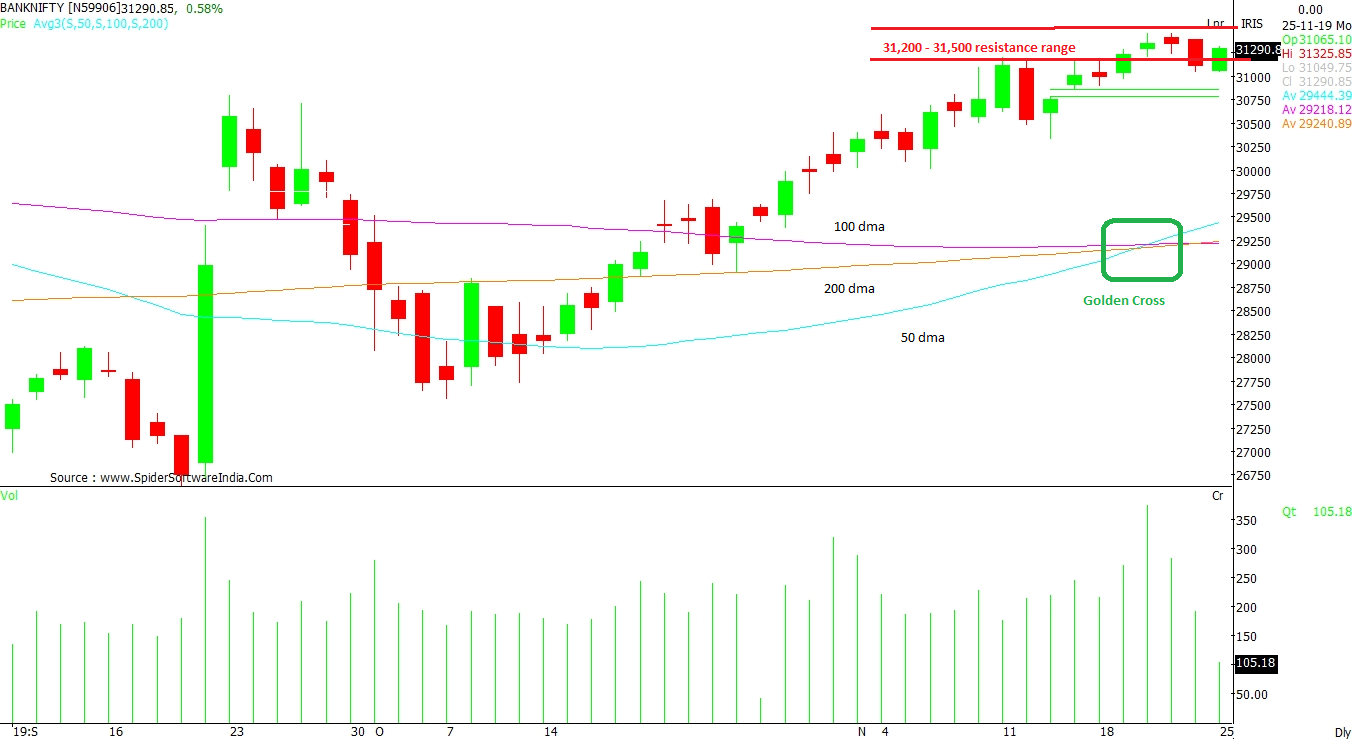
CLICK HERE FOR THE CHART NIFTY BANK: The index may breakout above 31,500 levels, which it has been trying to conquer from the past few sessions. The daily chart indicates selling pressure in the range 31,200 – 31,500. The support remains at 30,850 and 30,300. A “Golden Cross” of 200-days moving average (DMA) with 100 DMA and 50 DMA has strengthened the upside bias. The weekly chart shows a continuous positive closes in last seven sessions. A similar formation was seen way back in November 2014.
CLICK HERE FOR THE CHART
NIFTY IT: After the gap-down close on Friday, the index faces resistance at 15,200 levels. As the formation of 'Death Cross' had a negative impact on the trend, any upside from here may witness selling pressure. A successive close below 15,000 may take this index towards earlier lows of 14,566. The MACD has broken below signal line, a sign of concern in the coming sessions.
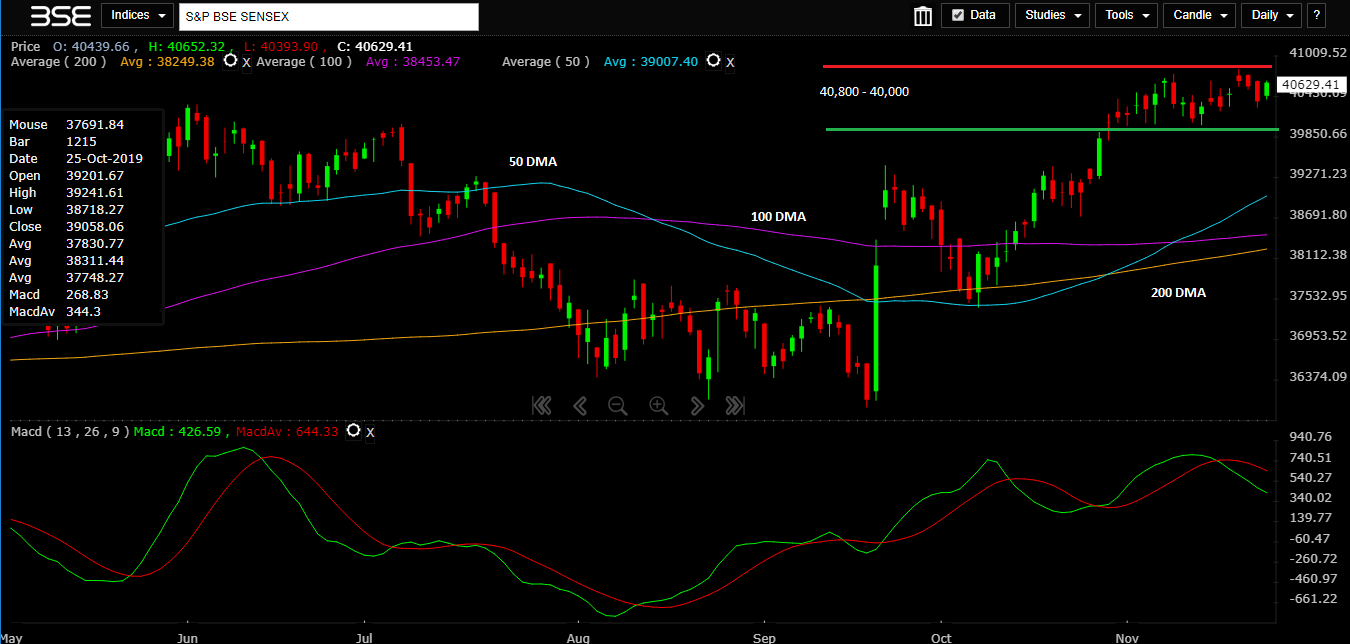
CLICK HERE FOR THE CHART  "Sensex can scale higher if it breaches 40,800; bank stocks likely to shine")


