Sensex, Nifty cross their respective highs, will see a major breakout

The underline trend seems positive as indices trade above the crucial moving averages i.e 200-day moving average (DMA), 100-DMA and 50-DMA. It helps to identify the sentiment of the market.

Stock market
Avdhut Bagkar Mumbai
2 min read Last Updated : Mar 11 2019 | 9:54 AM IST
The S&P BSE Sensex ended with a mild cut of 53 points or 0.15 per cent on Friday. The Nifty50 index closed 22 points or 0.21 per cent lower at 11,035. Indices traded flat with unchanged scenario having normal volatility. However, both the indices closed with strong gains on a weekly scale, rising more than 1 per cent.

The underline trend seems positive as indices trade above the crucial moving averages i.e 200-day moving average (DMA), 100-DMA and 50-DMA. It helps to identify the sentiment of the market.  

Nifty50: The index is trading closer to its previous high of 11,118 levels. The crossing of the same will indeed strengthen the upward move, as per the chart. The strong support comes in at 10,869, which is its 200-DMA. The immediate support falls at 10,950 level. The nearest exponential moving averages, 7-EMA and 11-EMA have made a positive crossover on daily chart, which supports the buying scenario.

The technical indicators MACD (moving average convergence and divergence) is well placed above zero line heading upward and RSI (Relative Strength Index) still has room to scale overbought territory as its trades at 62 levels. The trend looks heading towards next resistance of 11,350 levels. 
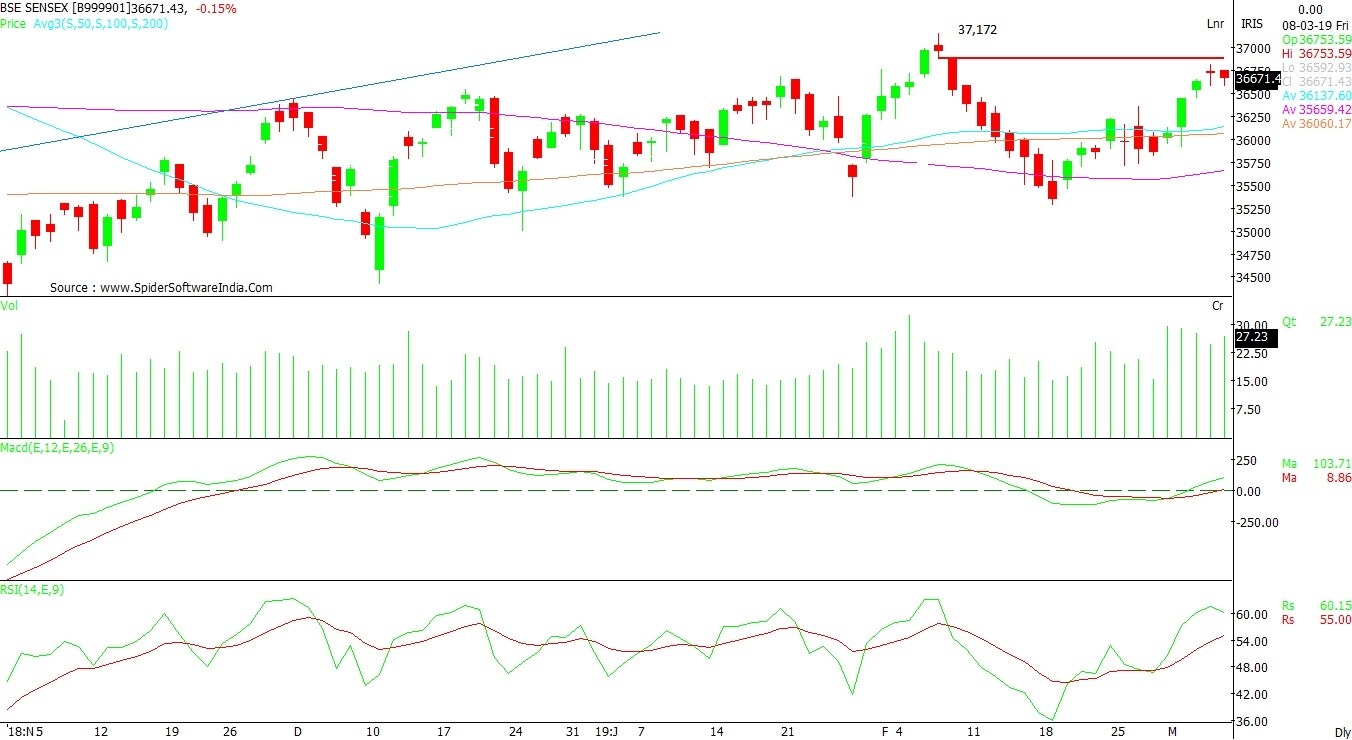
CLICK HERE TO VIEW CHART

BSE Sensex: The index is 500 points away from the previous high of 37,172 levels. It is witnessing selling pressure above 36,800. The gap down range of 36,898 – 36,885 seems to stay stronger at the current trend. The trend looks optimistic as it trades above the earlier resistance range of 36,300 – 36,450 levels.

The strongest support falls at 36,250 levels with immediate to be around 36,380 levels. It will see more buying if it crosses previous highs, leading towards resistance of 37,650 levels.

The 50-DMA is trading above 200-DMA indicative of buying in correction. When the index climbed 36,200 level last week, a strong upside momentum was noticed. CLICK HERE TO VIEW CHART

One subscription. Two world-class reads.

Already subscribed? Log in

Subscribe to read the full story →
*Subscribe to Business Standard digital and get complimentary access to The New York Times

Smart Quarterly

₹900

3 Months

₹300/Month

SAVE 25%

Smart Essential

₹2,700

1 Year

₹225/Month

SAVE 46%
*Complimentary New York Times access for the 2nd year will be given after 12 months

Super Saver

₹3,900

2 Years

₹162/Month

Subscribe

Renews automatically, cancel anytime

Here’s what’s included in our digital subscription plans

Exclusive premium stories online

  • Over 30 premium stories daily, handpicked by our editors

Complimentary Access to The New York Times

  • News, Games, Cooking, Audio, Wirecutter & The Athletic

Business Standard Epaper

  • Digital replica of our daily newspaper — with options to read, save, and share

Curated Newsletters

  • Insights on markets, finance, politics, tech, and more delivered to your inbox

Market Analysis & Investment Insights

  • In-depth market analysis & insights with access to The Smart Investor

Archives

  • Repository of articles and publications dating back to 1997

Ad-free Reading

  • Uninterrupted reading experience with no advertisements

Seamless Access Across All Devices

  • Access Business Standard across devices — mobile, tablet, or PC, via web or app

Next Story