So, has the rally in pharma stocks peaked out or there's more upside left? Take a look at what technical indicators suggest for Nifty Pharma and key pharma counters.
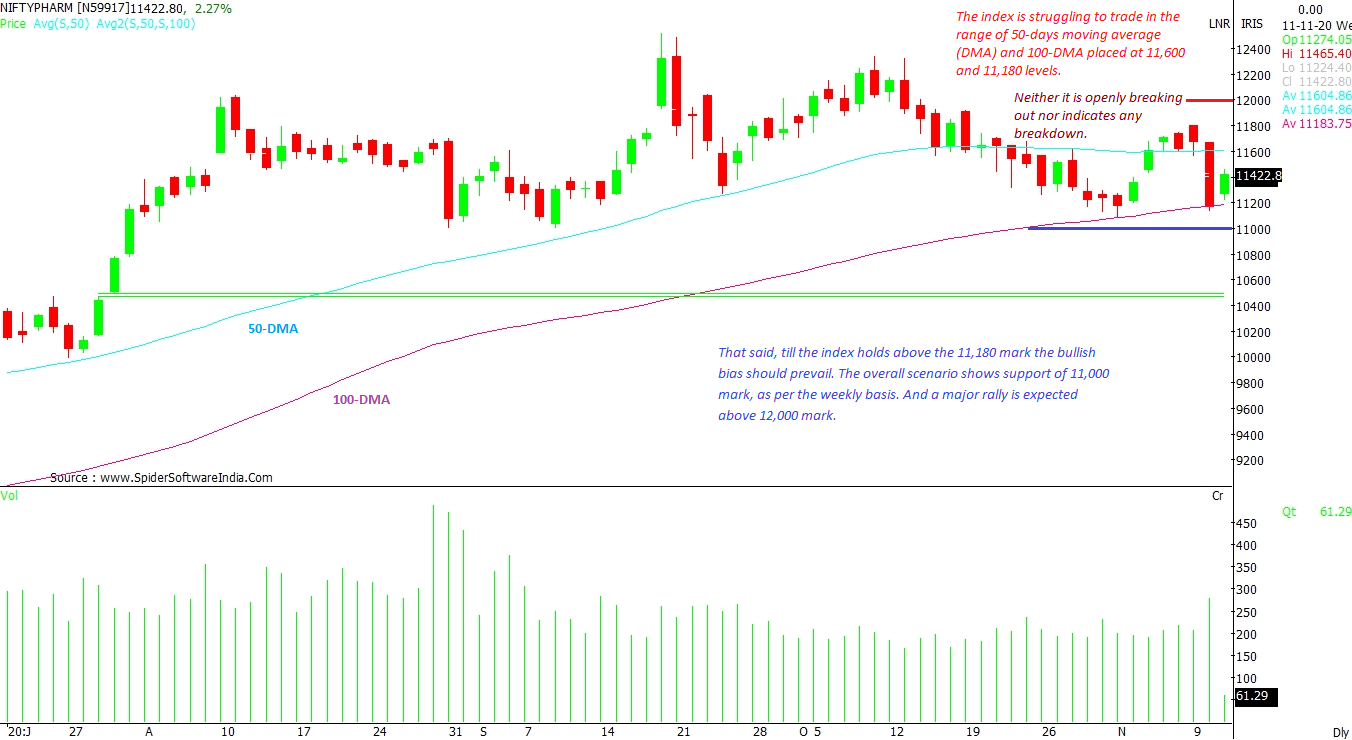
Nifty Pharma: The index is struggling to trade in the range of 50-day moving average (DMA) and 100-DMA placed at 11,600 and 11,180 levels. Neither it is decisively breaking out nor indicates any breakdown. That said, till the index holds above the 11,180 mark, the bullish bias should prevail. The overall scenario shows support at 11,000 mark, as per the weekly basis. And a major rally is expected above 12,000 mark.
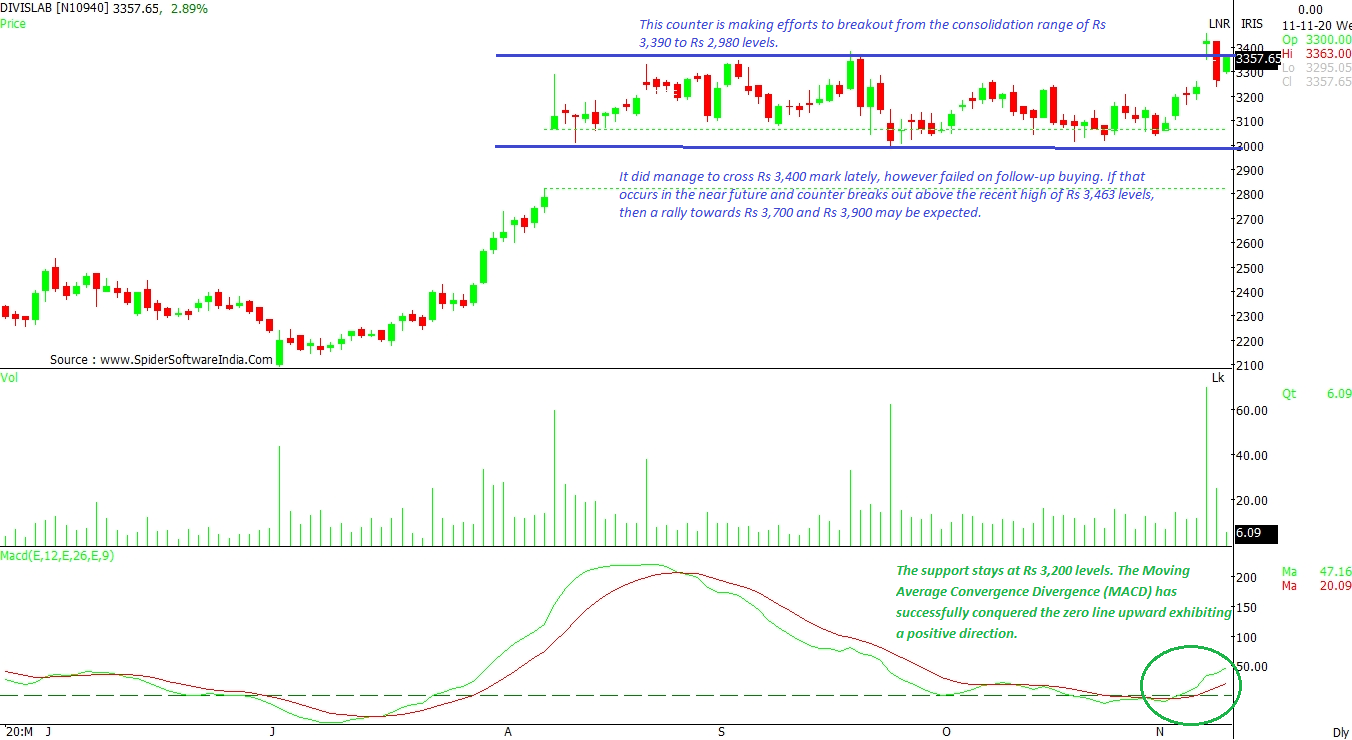
CLICK HERE FOR THE CHART Divi's Laboratories Ltd (DIVISLAB): This counter is making efforts to breakout from the consolidation range of Rs 3,390 to Rs 2,980 levels. It did manage to cross Rs 3,400 mark lately, however it failed on follow-up buying. If that occurs in the near future and counter breaks out above the recent high of Rs 3,463 levels, then a rally towards Rs 3,700 and Rs 3,900 may be expected. The support stays at Rs 3,200 levels. The Moving Average Convergence Divergence (MACD) has successfully conquered the zero line upward exhibiting a positive direction.
CLICK HERE FOR THE CHART Lupin Ltd (LUPIN): This counter is losing the glitter slowly. The formation on the daily chart signifies a weak sentiment as the stock failed to hold Rs 950 mark. Now, as it gets closer to 200-DMA placed at Rs 854 levels, a positive rebound is expected. If that happens, the stock needs to challenge the resistance of Rs 950 levels. A breakdown below Rs 854 may see an immense selling pressure leading towards Rs 780 levels.
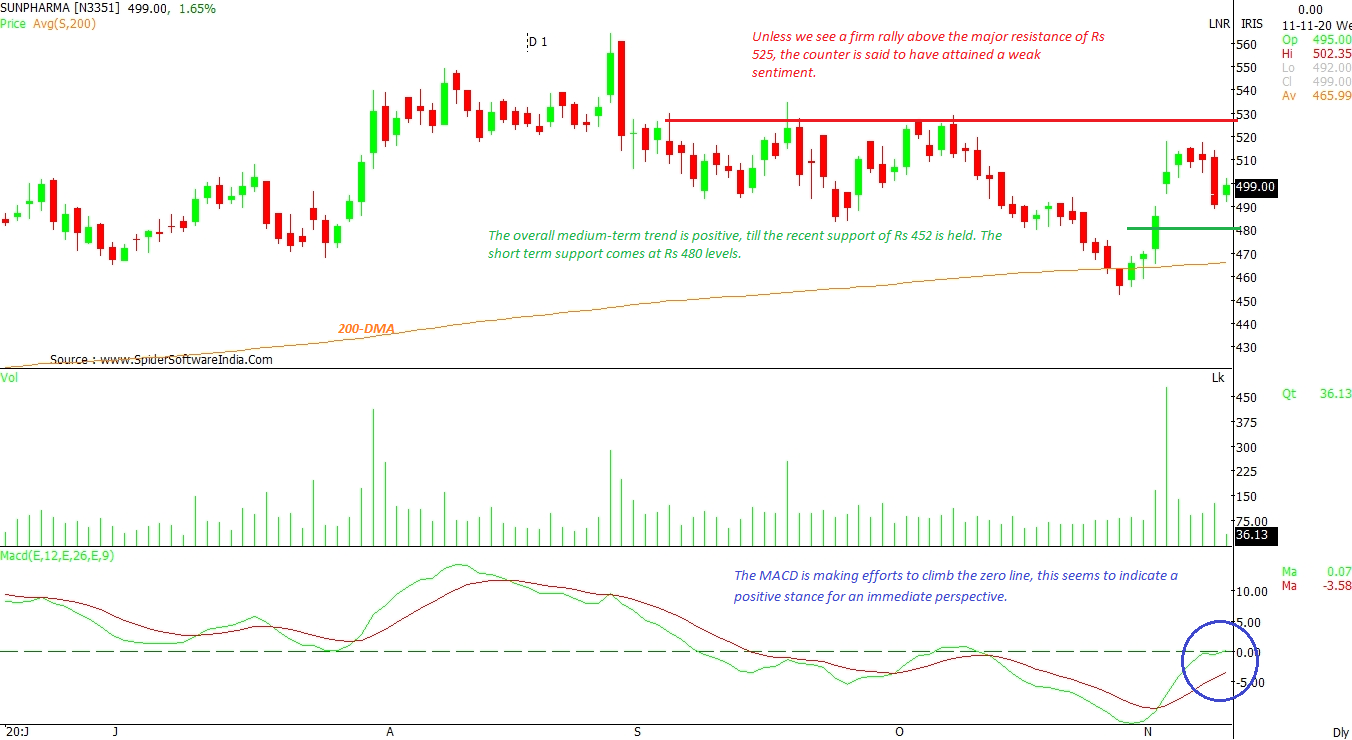
CLICK HERE FOR THE CHART Sun Pharmaceutical Industries Ltd (SUNPHARMA): Unless we see a firm rally above the major resistance of Rs 525, the counter is said to have attained a weak sentiment. The overall medium-term trend is positive, till the recent support of Rs 452 is held, which is slightly below 200-DMA . The short term support comes in at Rs 480 levels. The MACD is making efforts to climb the zero line, this seems to indicate a positive stance for an immediate perspective.
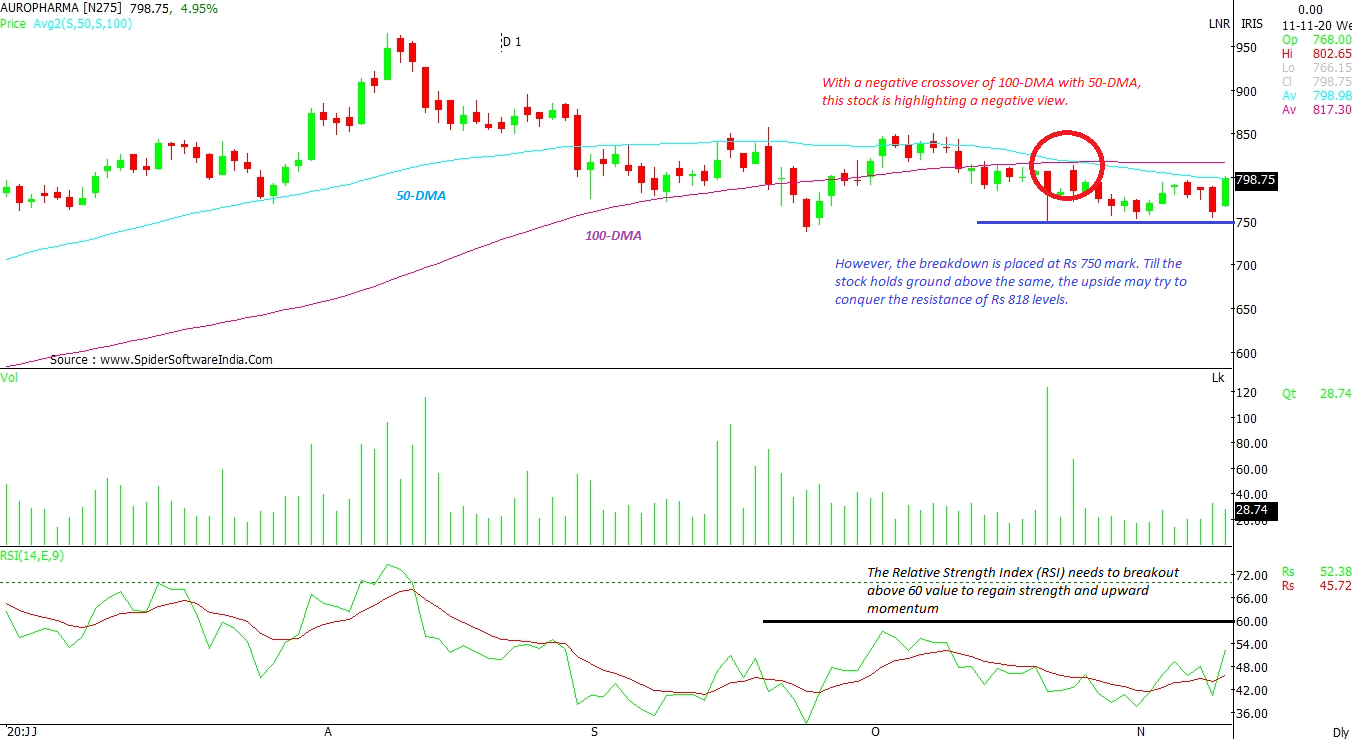
CLICK HERE FOR THE CHART Aurobindo Pharma (AUROPHARMA): With a negative crossover of 100-DMA with 50-DMA, this stock is exhibiting a negative view. However, the breakdown is placed at Rs 750 mark. Till the stock holds ground above the same, the upside may try to conquer the resistance of Rs 818 levels. The Relative Strength Index (RSI) needs to breakout above 60 value to regain strength and upward momentum.
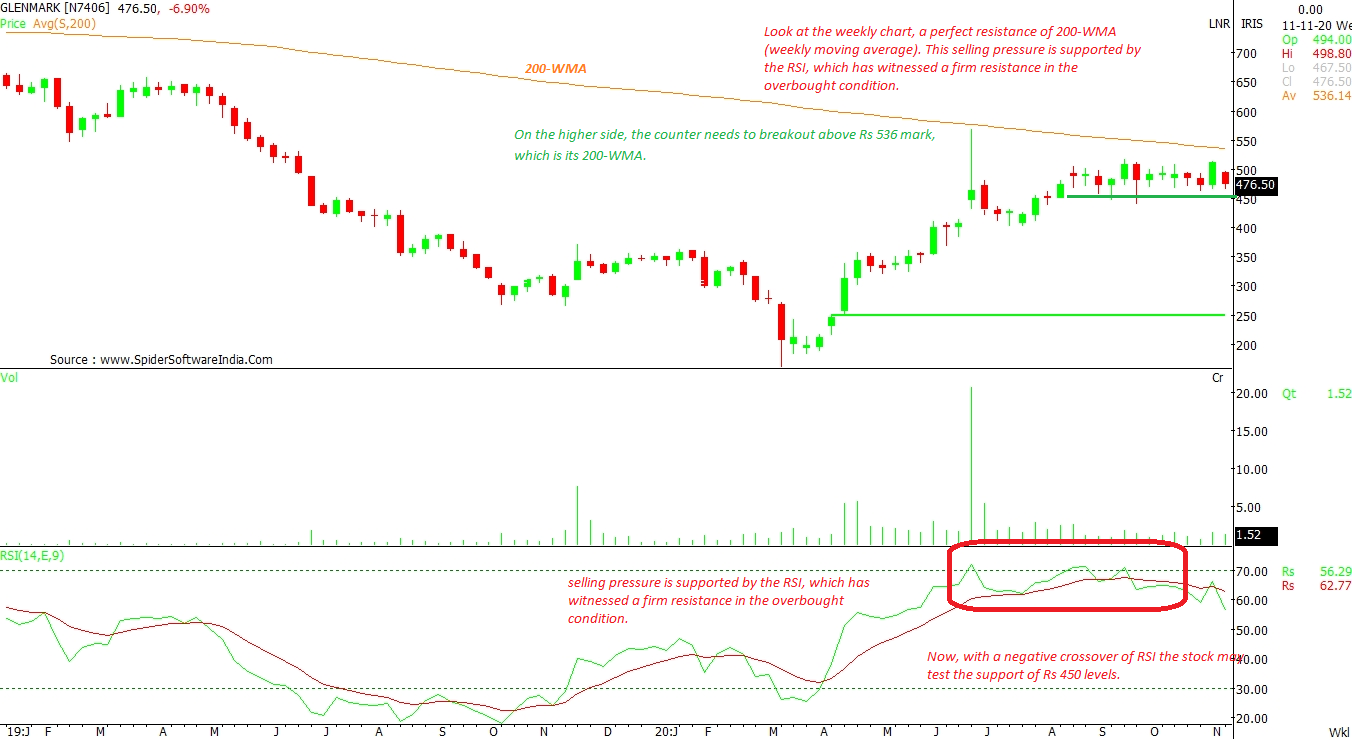
CLICK HERE FOR THE CHART Glenmark Pharmaceuticals (GLENMARK): Look at the weekly chart, a perfect resistance of 200-WMA (weekly moving average). This selling pressure is supported by the RSI, which has witnessed a firm resistance in the overbought condition. Now, with a negative crossover of RSI, the stock may test the support of Rs 450 levels. On the higher side, the counter needs to breakout above Rs 536 mark, which is its 200-WMA.
CLICK HERE FOR THE CHART  "Divi's Lab, Aurobindo Pharma: Are pharma stocks losing their sheen? Read on")


