"An expected and interesting feature of the market trend now is the outperformance of the banking segment, which has been resilient even during market weakness. This trend may continue since there is valuation comfort in this segment," says VK Vijaykumar, chief investment strategist at Geojit Financial Services.
Besides, according to reports, the government is likely to pump capital in public sector banks during the last quarter of the current financial year to meet the regulatory requirements.
READ ABOUT IT HERE Against this backdrop, here's how PSU bank stocks look on charts:
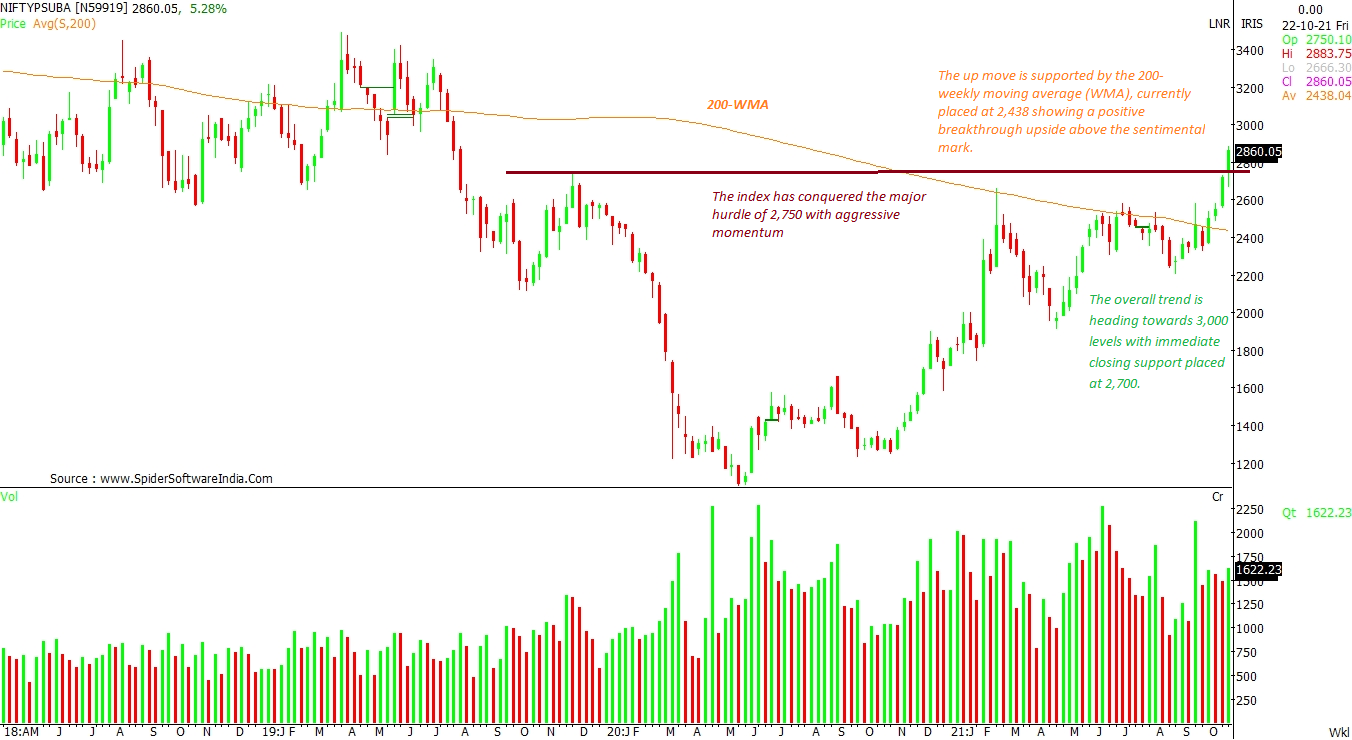
NIFTY PSU BANKS (NIFTYPSUBA) Likely target: 3,000 Upside potential: 5% The index has conquered the major hurdle of 2,750 with aggressive momentum, according to the weekly chart. This up move is supported by the 200-weekly moving average (WMA), currently placed at 2,438. The overall trend is heading towards 3,000 levels with an immediate closing support placed at 2,700.
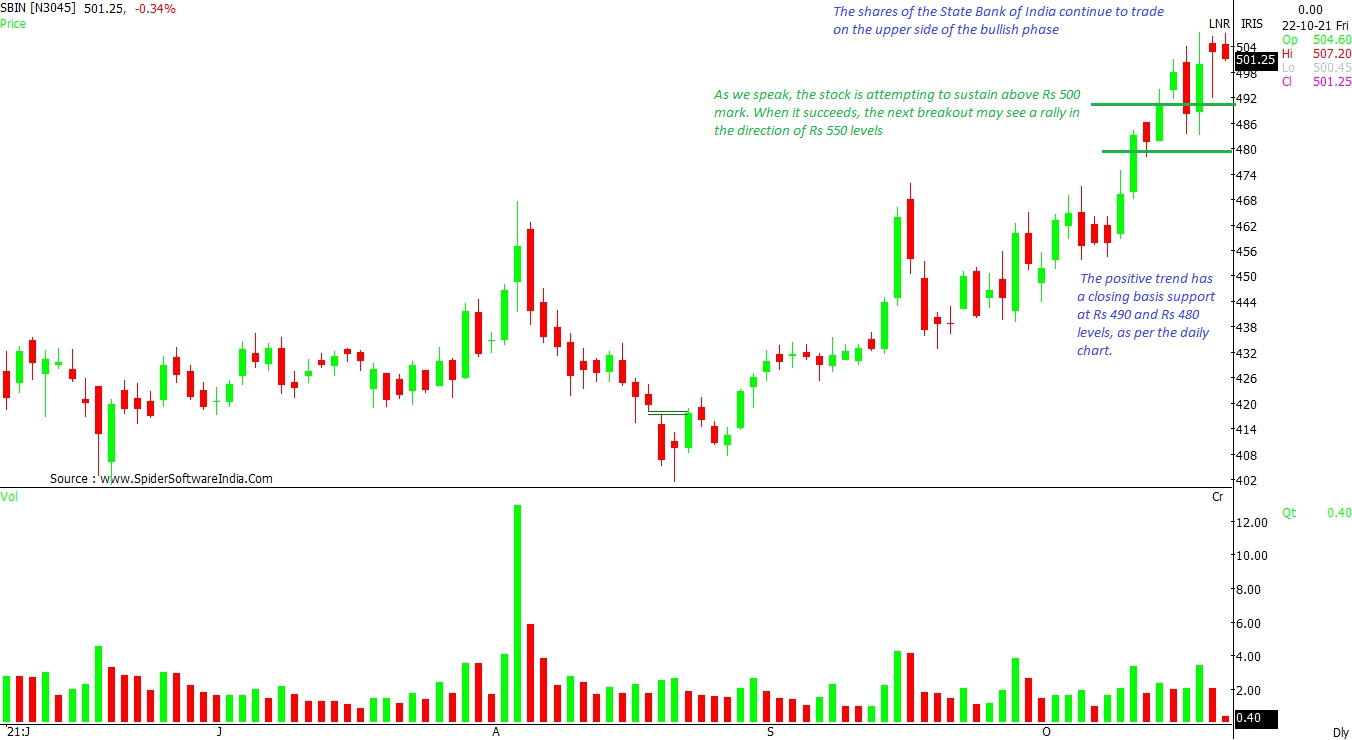
CLICK HERE FOR THE CHART State Bank of India (SBIN) Likely target: Rs 550
Upside potential: 10%
The shares of the State Bank of India continue to trade on the upper side of the bullish phase. Currently, the stock is attempting to sustain above Rs 500-mark. If it succeeds, the next breakout may see a rally in the direction of Rs 550 levels. The positive trend has a closing basis support at Rs 490 and Rs 480 levels, as per the daily chart.
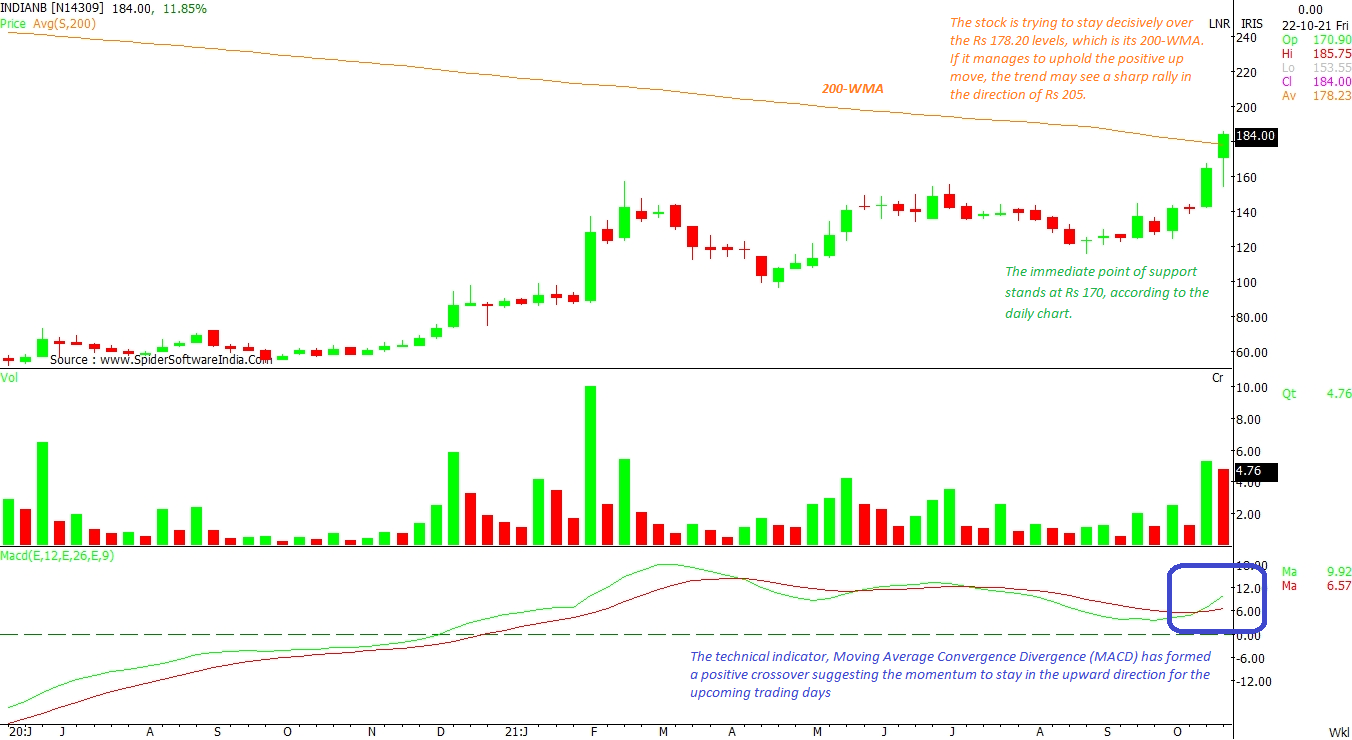
CLICK HERE FOR THE CHART Indian Bank (INDIANB)
Likely target: Rs 205
Upside potential: 12%
The stock is trying to stay decisively over the Rs 178.20 levels, which is its 200-WMA. If it manages to uphold the positive up move, the trend may see a sharp rally in the direction of Rs 205. The technical indicator, Moving Average Convergence Divergence (MACD), has formed a positive crossover suggesting that the momentum is likely to stay in the upward direction in days ahead. The immediate point of support stands at Rs 170, according to the daily chart.
CLICK HERE FOR THE CHART Bank of Baroda (BANKBARODA) Likely target: Rs 99.85 and Rs 108
Upside potential: 4% to 11%
A decisive close above Rs 95.10 levels, which is the 200-WMA, shows an immediate rally towards 52-weeks high of Rs 99.85 levels. And if this mark also sees the buying accumulation, then the next rally may eventually lead to Rs 108, which is the subsequent resistance, according to the weekly chart. The closing basis support stays at Rs 92 levels.
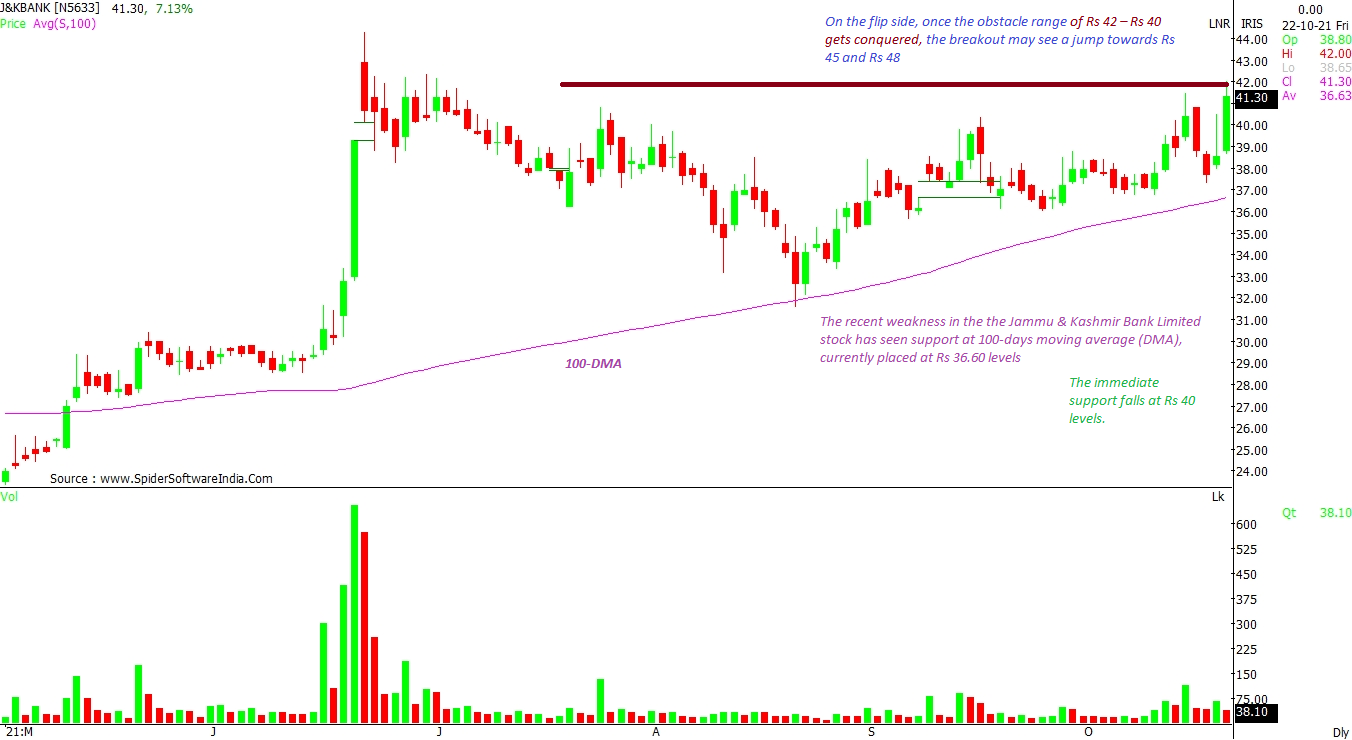
CLICK HERE FOR THE CHART The Jammu & Kashmir Bank Limited (J&KBANK) Likely target: Rs 45 and Rs 48
Upside potential: 7% to 14%
The recent weakness in the the Jammu & Kashmir Bank Limited stock has seen support at 100-days moving average (DMA), currently placed at Rs 36.60 levels. On the flip side, once the obstacle range of Rs 42 – Rs 40 gets conquered, the breakout may see a jump towards Rs 45 and Rs 48, according to the daily chart. The immediate support falls at Rs 40 levels.
CLICK HERE FOR THE CHART  "State Bank of India, Bank of Baroda: 4 PSBs to buy for up to 15% upside")


