Against this backdrop, how does the Group look on charts now? Here's a technical viewpoint:
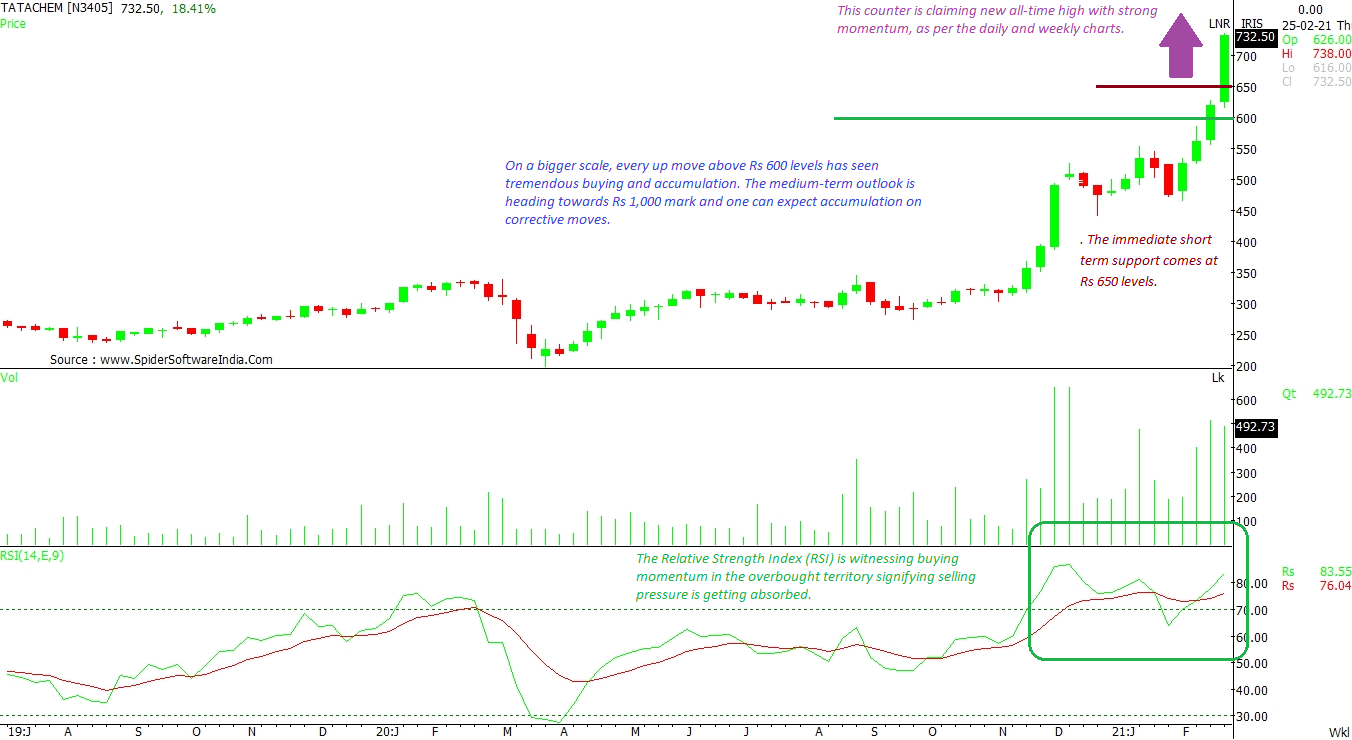
Tata Chemicals Ltd (TATACHEM): This stock has touched a new all-time high, on February 25, on the back of heavy volumes. The Relative Strength Index (RSI) is witnessing buying momentum even in the overbought territory, signifying that the stock is firm enough to absorb any downward pressure. Besides, any move above Rs 600 levels witnessed tremendous buying and accumulation. Given this, the stock looks poised to hit Rs 1,000-mark over the medium term and one can expect accumulation on any mild correction. The immediate short-term support comes at Rs 650 levels.
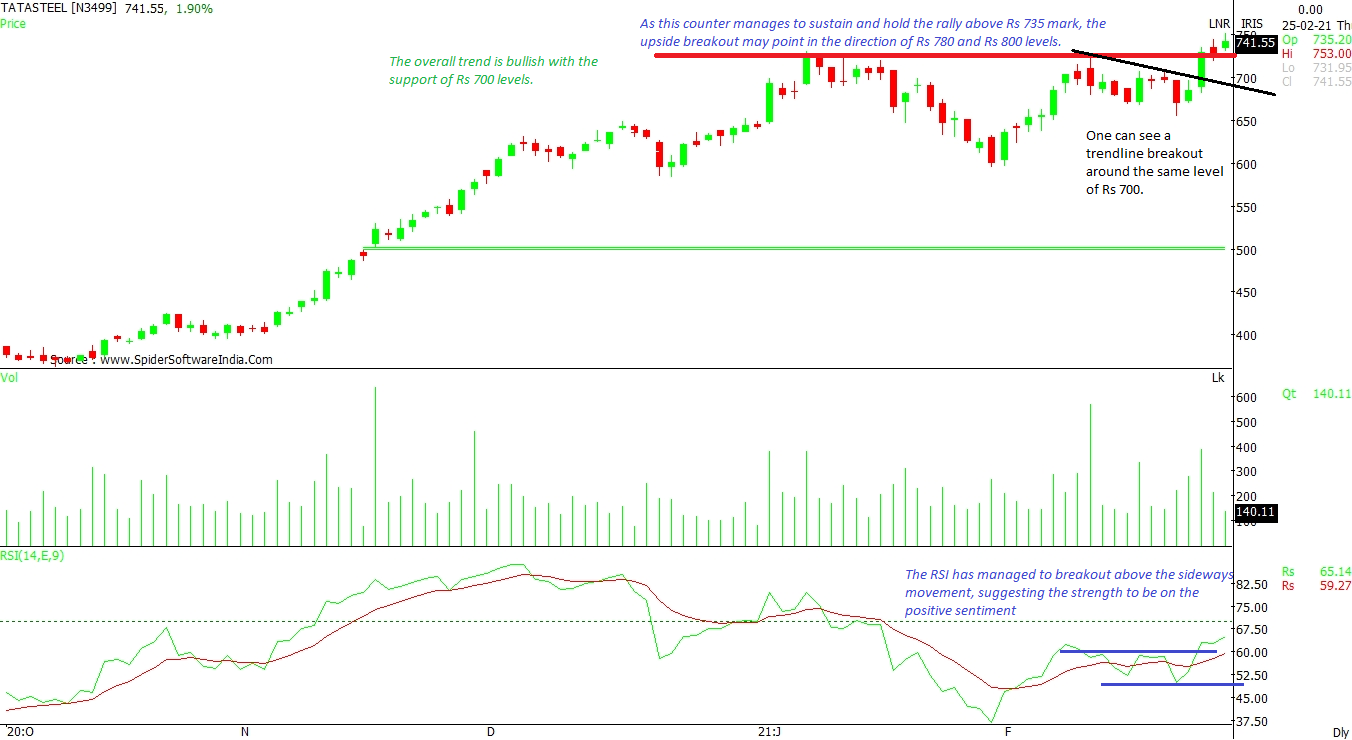
CLICK HERE FOR THE CHART Tata Steel Ltd (TATASTEEL): As the stock manages to sustain its rally above Rs 735-mark, any fresh breakout may push the price towards Rs 780 and Rs 800 levels. The overall trend is bullish with a support placed at Rs 700 levels. One can also see a trendline breakout around the same level, as per the daily chart. Moreover, the RSI has managed to break above the sideways movement, suggesting the underlying positive sentiment.
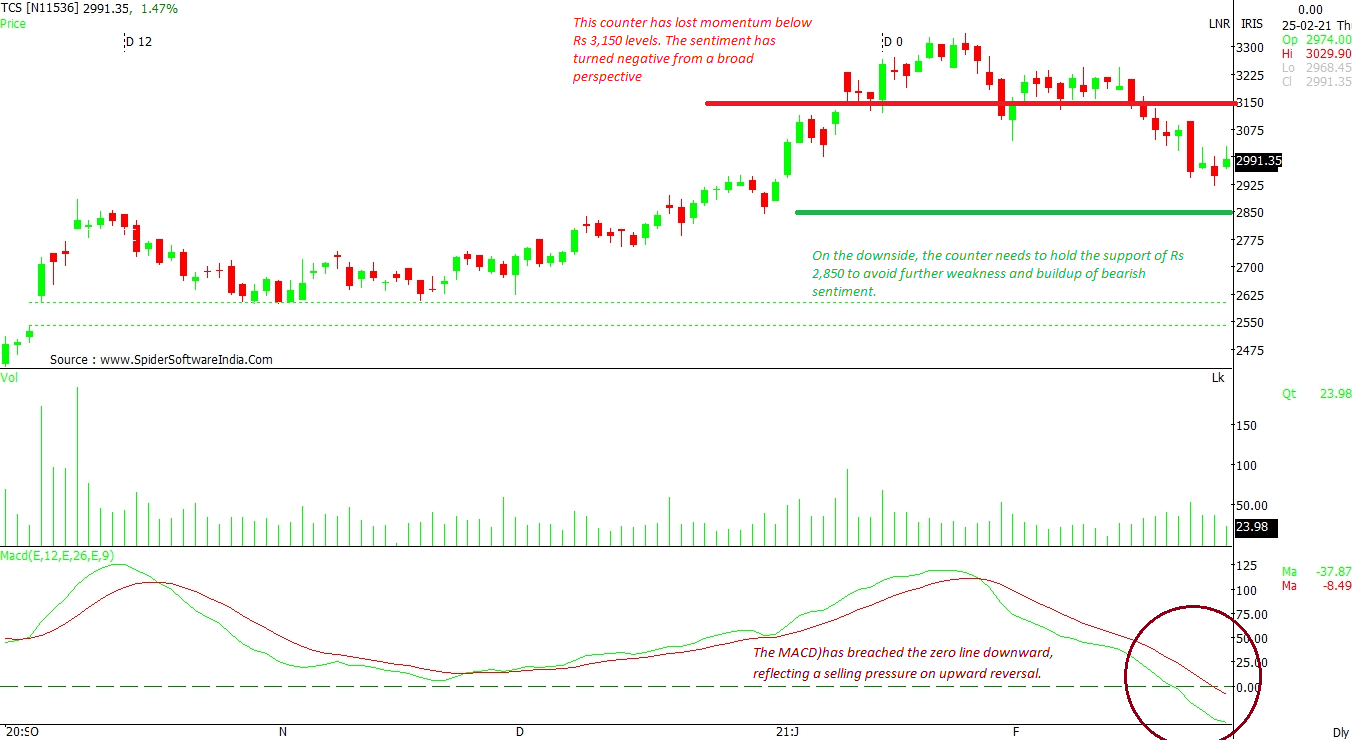
CLICK HERE FOR THE CHART Tata Consultancy Services (TCS): As per the daily chart, the IT scrip lost its momentum below the Rs 3,150-mark. The stock now needs to hold the support of Rs 2,850 to avoid further weakness and build-up of bearish sentiment. The Moving Average Convergence Divergence (MACD) has breached the zero line downward, reflecting a selling pressure on upward reversal.
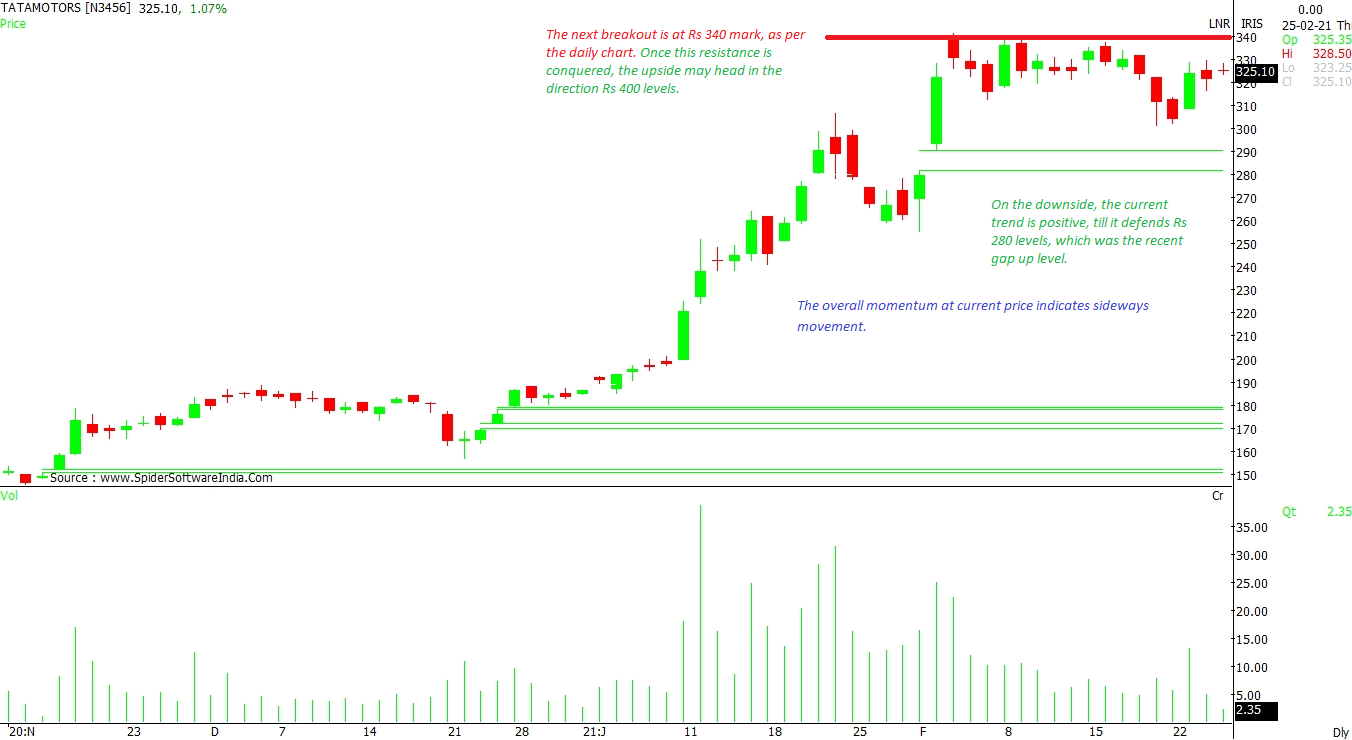
CLICK HERE FOR THE CHART Tata Motors Ltd (TATAMOTORS): After a strong rally so far in the month of February, the stock is facing resistance at Rs 340-mark, as per the daily chart. Once this resistance is conquered, the upside may see the rally getting extended towards Rs 400 levels. That said, the stock needs to defend Rs 280 levels to maintain the positive sentiment. Overall, the stock is witnessing a consolidation at the current juncture.
CLICK HERE FOR THE CHART Tata Consumer Products Ltd (TATACONSUM): This stock needs to conquer the resistance of Rs 640, supported by strong volumes, to see further strength. For now, the support range of Rs 610 to Rs 600 seems to support the upside bias. That said, MACD is trading with a positive crossover, suggesting an upward momentum, as per the daily chart.
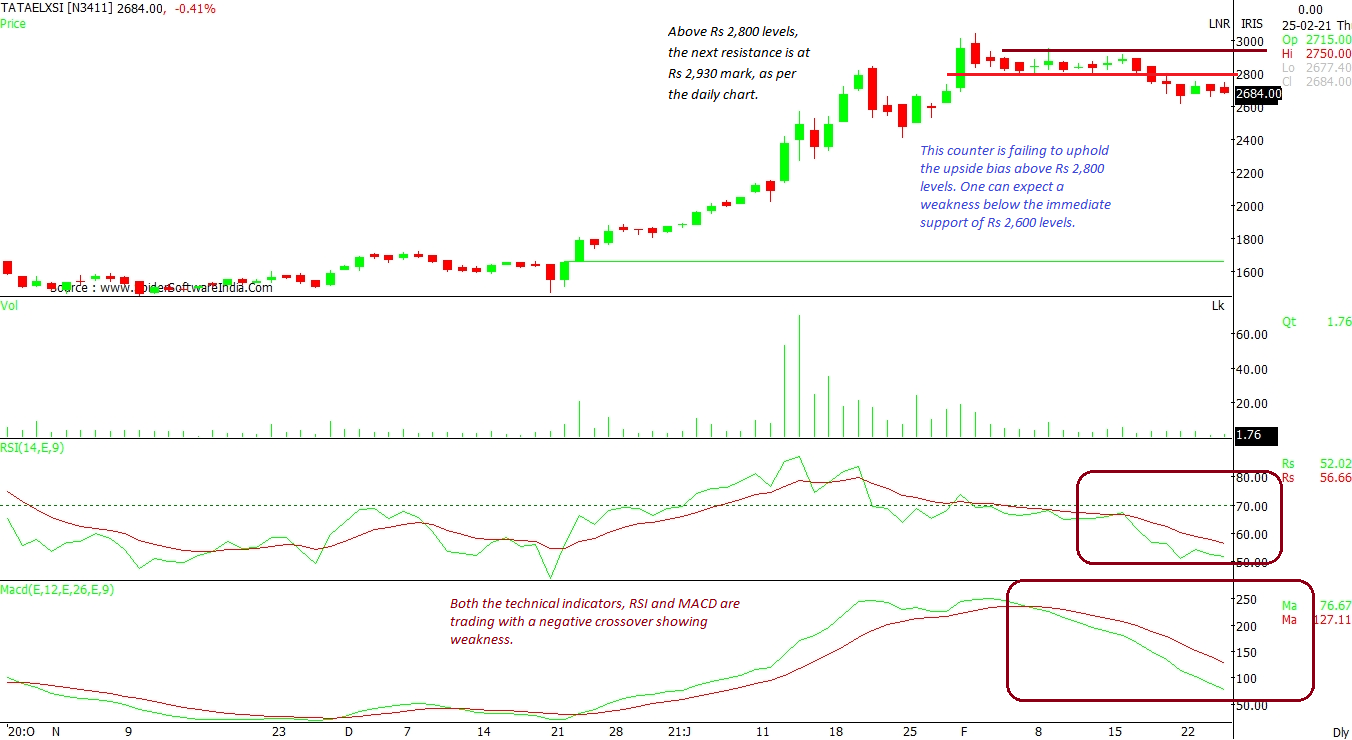
CLICK HERE FOR THE CHART Tata Elxsi Ltd (TATAELXSI): This stock is failing to uphold the upside bias above Rs 2,800 levels. One can expect a weakness to aggravate if it falls below the immediate support of Rs 2,600 levels. Both the technical indicators, RSI and MACD, are trading with a negative crossover suggesting weakness. Above Rs 2,800 levels, resistance is seen at Rs 2,930 mark, as per the daily chart.
CLICK HERE FOR THE CHART
 "Tata Motors, Tata Consumer: Tata Group stks may lead the next market rally")


