In such a scenario, do the Indian markets have more steam left in them?
Here's how the major benchmarks look from a technical point of view
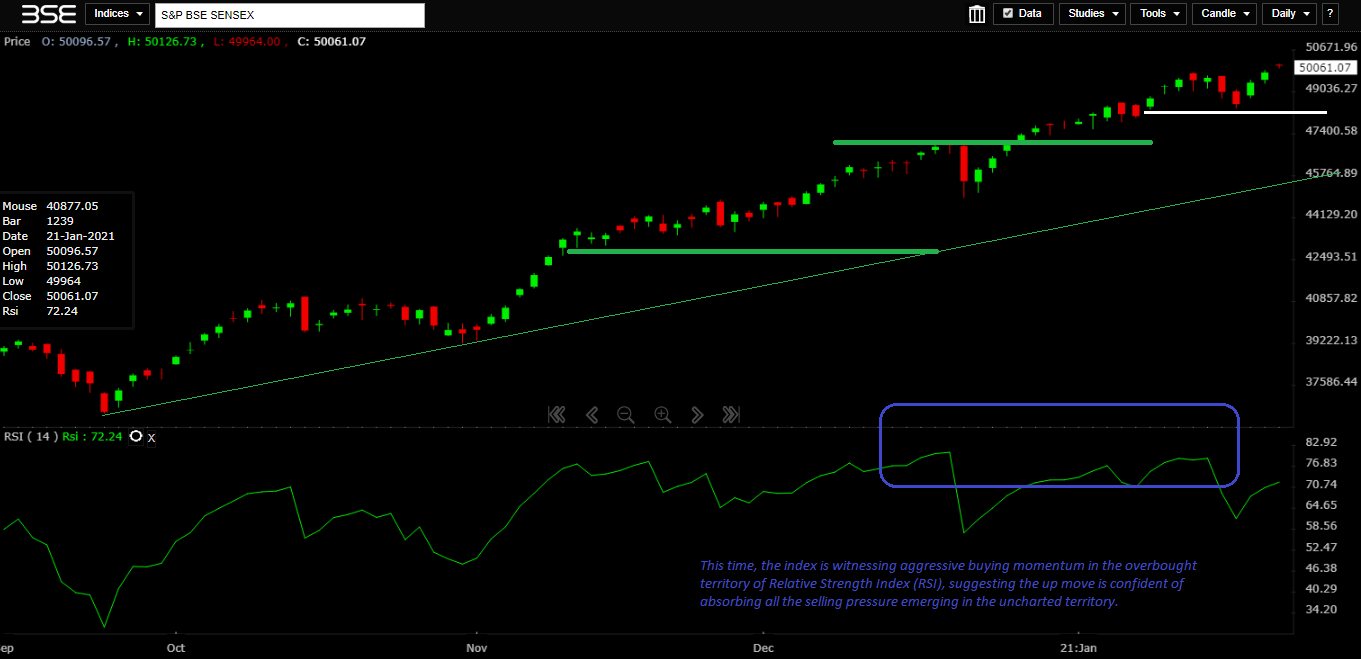
S&P BSE SENSEX: With such a reversal nearing 48,000 recently, the index is set to rise towards 54,000 levels in the next six months, as per the daily and weekly charts. This time, the index is witnessing aggressive buying momentum in the overbought territory of Relative Strength Index (RSI), suggesting the up move is confident of absorbing all the selling pressure emerging in the uncharted territory. The upside sentiment is strong above the support of 48,000 levels.
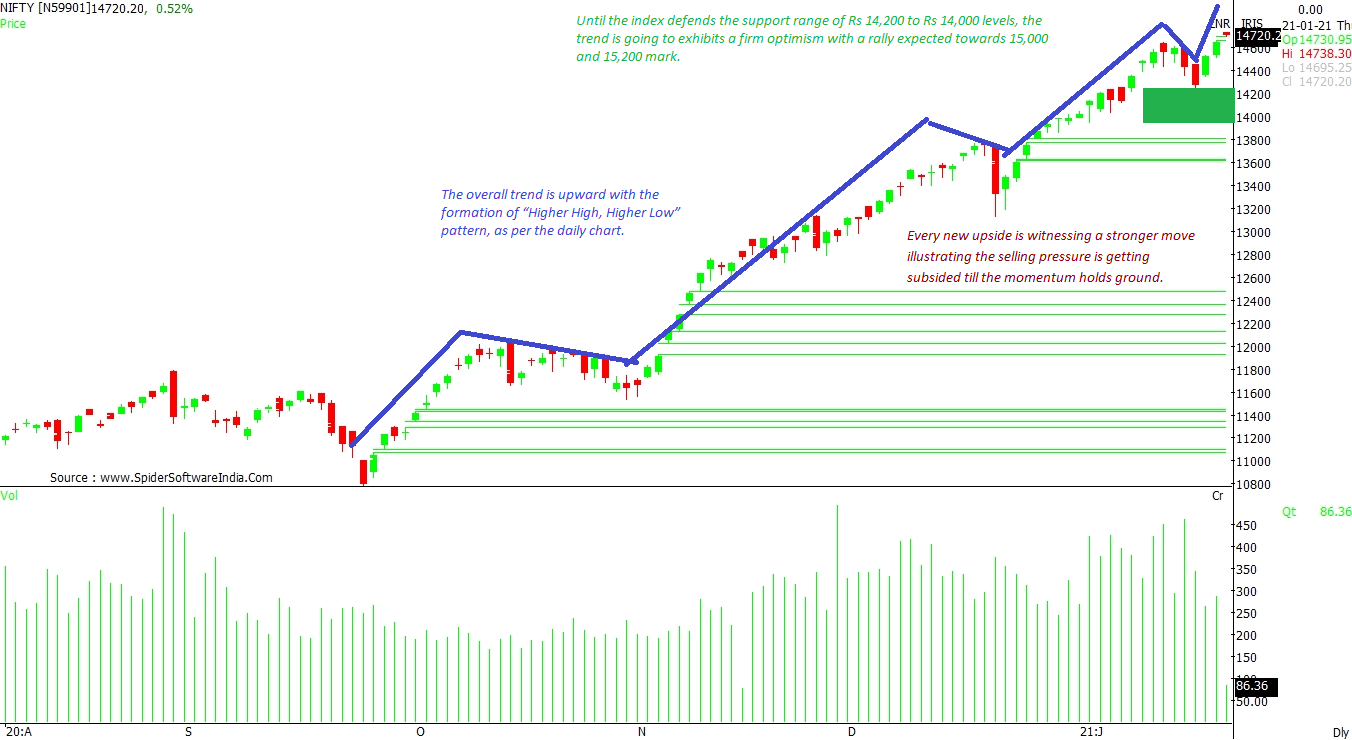
CLICK HERE FOR THE CHART NIFTY50: Until the index defends the support range of 14,200 to 14,000 levels, the trend is that of a firm optimism with a rally expected towards 15,000 and 15,200 mark. The overall trend is upward with the formation of "Higher High, Higher Low" pattern, as per the daily chart. Every new upside is witnessing a stronger move, illustrating that the selling pressure is getting subsided.
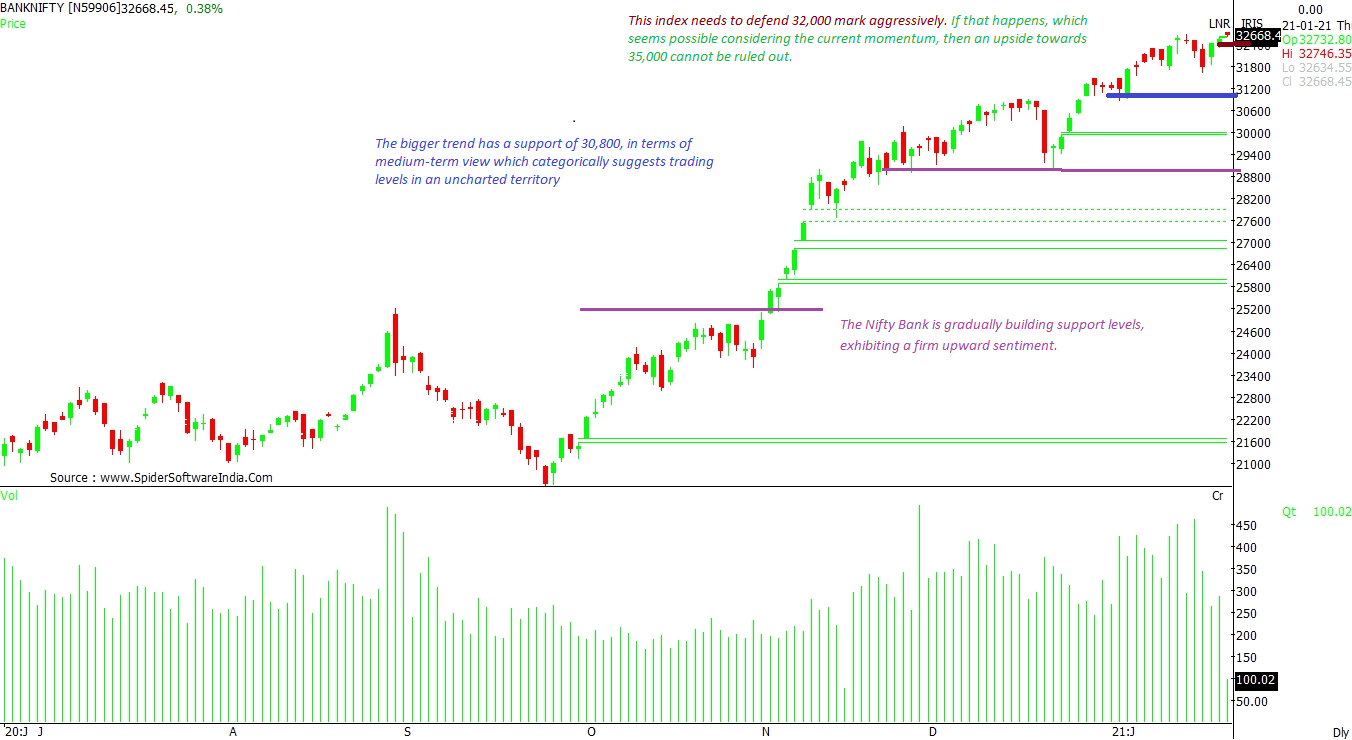
CLICK HERE FOR THE CHART NIFTYBANK: This index needs to defend 32,000 mark aggressively. If that happens -- which seems possible, considering the current momentum -- then an upside towards 35,000 cannot be ruled out. The bigger trend has a support of 30,800, in terms of medium-term view which categorically suggests trading levels in an uncharted territory, as per the daily charts. The Nifty Bank is gradually building support levels, exhibiting a firm upward sentiment.
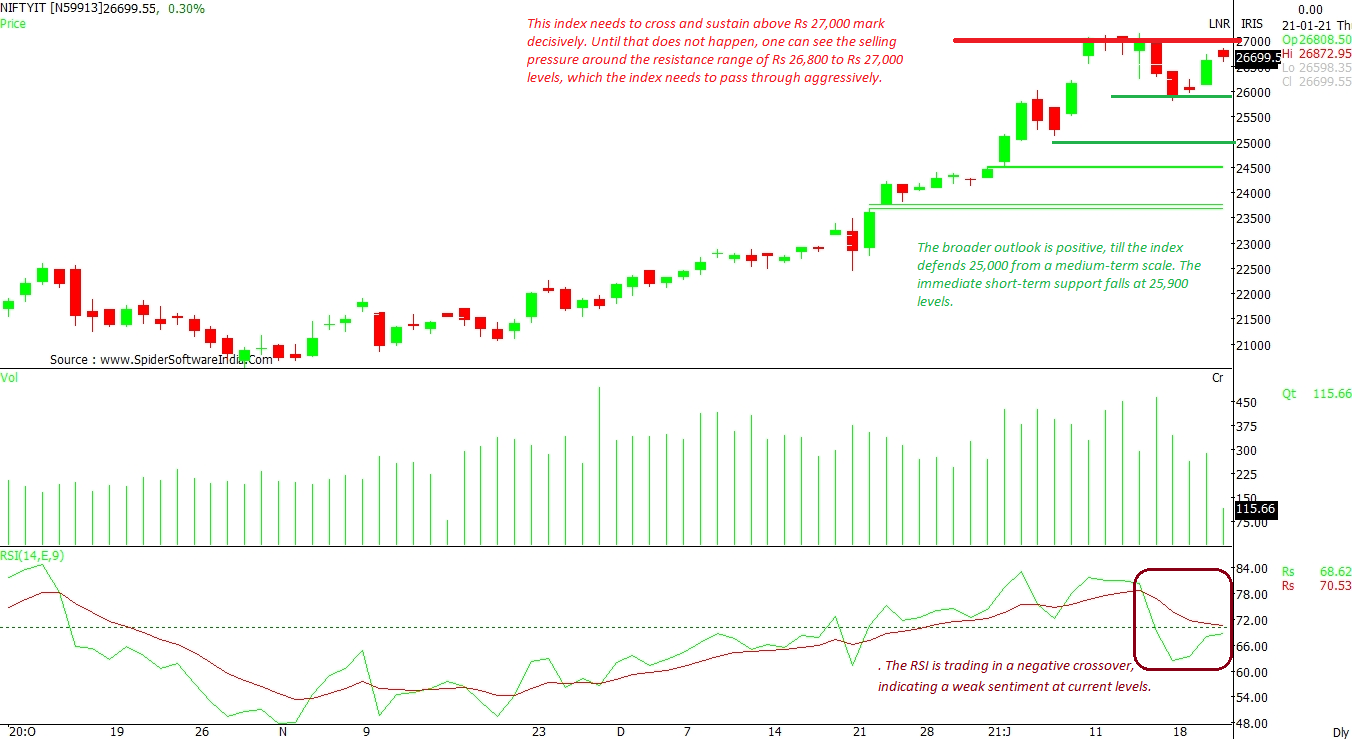
CLICK HERE FOR THE CHART NIFTY IT: This index needs to cross and sustain above the 27,000 mark decisively. Until it happens, one might see selling pressure around the resistance range of 26,800 to 27,000 levels, which the index needs to pass through, aggressively. From a medium-term scale, the broader outlook is positive, until the time the index defends 25,000. The RSI is trading in a negative crossover, indicating weak sentiment at current levels.
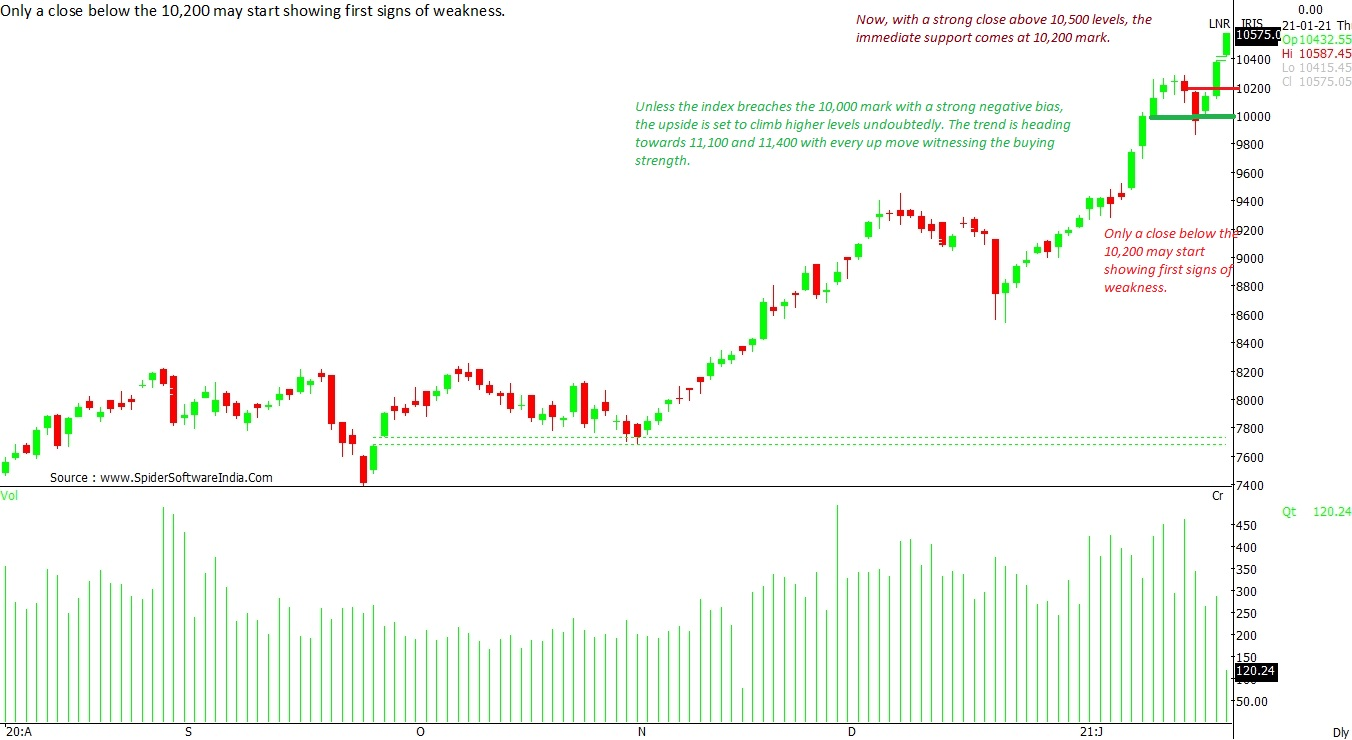
CLICK HERE FOR THE CHART NIFTY AUTO: Unless the index breaches the 10,000 mark with a strong negative bias, the upside is set to climb higher levels undoubtedly. The trend is heading towards 11,100 and 11,400 with every up move witnessing buying strength. Now, with a strong close above 10,500 levels, the immediate support comes at 10,200 mark. Only after a close below the 10,200, the index may start showing first signs of weakness.
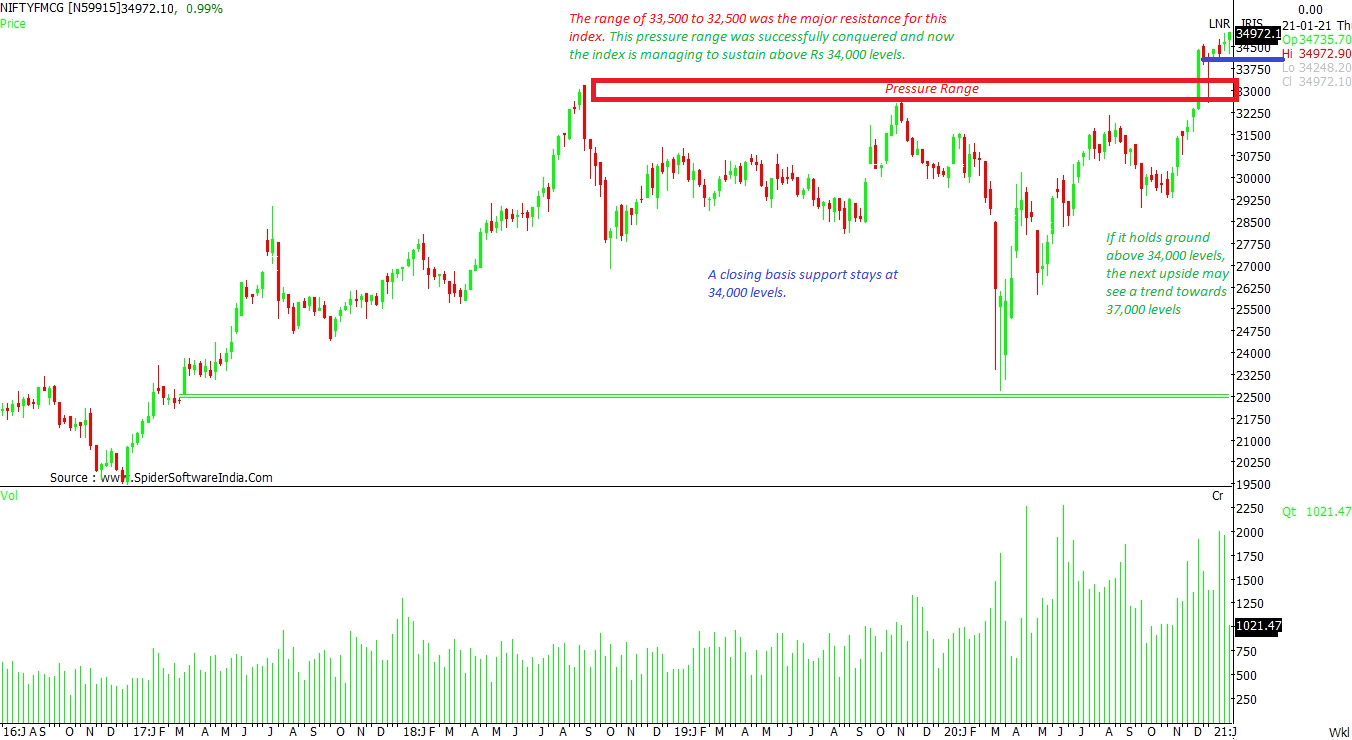
CLICK HERE FOR THE CHART NIFTY FMCG: The range of 33,500 to 32,500 was the major resistance for this index. This pressure range was successfully conquered and now the index is managing to sustain above Rs 34,000 levels. If it holds ground above 34,000 levels, the next upside may see a trend towards 37,000 levels, as per the weekly and daily chart. A closing basis support stays at 34,000 levels.
CLICK HERE FOR THE CHART  "Tech view: Sensex may hit 54,000 within next six months, charts show")


