Top technical indicators that every rookie trader should know about

The technical analysis revolves around three major indicators: the price indicator, volume, and basic technical indicators that determine strength, oscillation, and momentum.

markets
Price is the most significant indicator of any trend. It can determine the course without any assistance from volume or technical indicators.
Avdhut Bagkar Mumbai
3 min read Last Updated : Aug 27 2020 | 8:55 AM IST
To be a successful trader, one should first be able to read a chart with conviction. Secondly, there is nothing called a 'perfect' method of trading. It evolves with experience and consistent efforts to enhance and rectify the trading model.

A trader's psychology is to benefit from the price move which is trending or is on the reversal. Technical analysis can assist traders in that process. Technical analysis revolves around three major indicators: the price indicator, volume, and basic technical indicators that determine strength, oscillation, and momentum.

Price Indicator

Price is the most significant indicator of any trend. It can determine the course without any assistance from volume or technical indicators. Price can be analysed using several instruments like Moving averages, Bollinger Band, Fibonacci Retracement, trendline, candlestick patterns.  

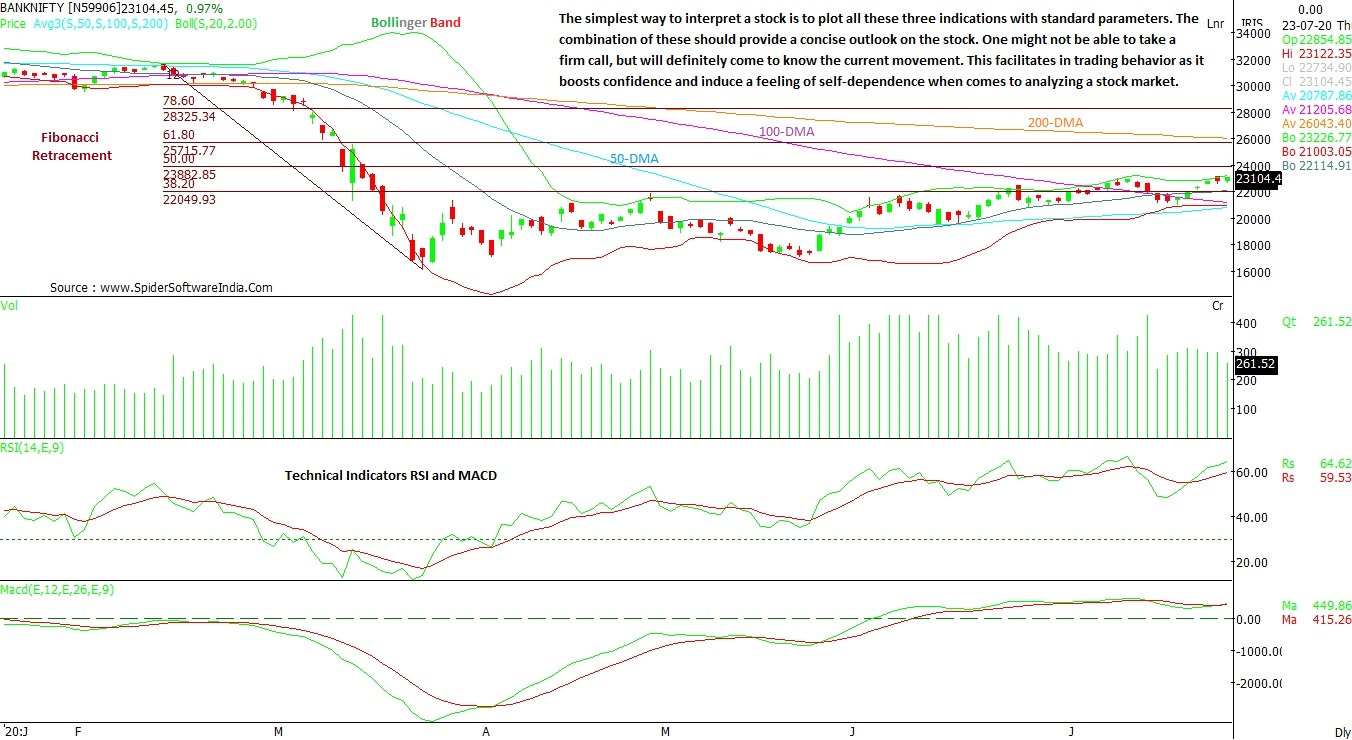
Moving average includes 50-day moving average (DMA), 100-DMA, and 200-DMA. Standard parameters help to understand the price trend. Price above these averages show bullish sentiment. Bollinger band defines price in standard deviation with 20-DMA differentiating the price. And, Fibonacci retracement is based on the Golden Ratio that recognizes support and resistance levels.

Lastly, analysing a candle on the basis of candlestick patterns is in itself a separate and vast topic. But, basically, bullish candle and bearish candle define the current trend.

Volume

The study of volumes can help one visualise the interest of market participants in the stock.

One can study volumes to identify the selling pressure and the underneath support/ resistance levels that reveal crucial movements. With their help, one can also determine the significance of a swing trade. A robust surge in volume on a breakout, meanwhile, clearly underlines the possibility of a strong upside. In such cases, follow-up buying provides further conviction which, in turn, helps in achieving target and preventing losses.  

Technical Indicators

There are numerous indicators that reflect the price trend in their own composition. The idea is to recognize the position of a stock. A rising stock may not always show a firm upside, but may be gradually inching upward. Such a stock may not even have the strength, but understanding the position assists in identifying the positive or negative outlook of a stock price. Relative Strength Index (RSI) caters in understanding the strength with overbought and oversold conditions.  Moving Average Convergence Divergence (MACD) identifies direction, momentum and duration of a trend.

Keep it simple

The simplest way to interpret a stock is to plot all these three indicators with standard parameters. The combination of these should provide a concise outlook on the stock. One may not be able to take a firm call, but will definitely identify the current movement. This facilitates trading behavior as it boosts confidence and induces a feeling of self-dependence when it comes to analysing the stock market. CLICK HERE TO VIEW THE CHART

One subscription. Two world-class reads.

Already subscribed? Log in

Subscribe to read the full story →
*Subscribe to Business Standard digital and get complimentary access to The New York Times

Smart Quarterly

₹900

3 Months

₹300/Month

SAVE 25%

Smart Essential

₹2,700

1 Year

₹225/Month

SAVE 46%
*Complimentary New York Times access for the 2nd year will be given after 12 months

Super Saver

₹3,900

2 Years

₹162/Month

Subscribe

Renews automatically, cancel anytime

Here’s what’s included in our digital subscription plans

Exclusive premium stories online

  • Over 30 premium stories daily, handpicked by our editors

Complimentary Access to The New York Times

  • News, Games, Cooking, Audio, Wirecutter & The Athletic

Business Standard Epaper

  • Digital replica of our daily newspaper — with options to read, save, and share

Curated Newsletters

  • Insights on markets, finance, politics, tech, and more delivered to your inbox

Market Analysis & Investment Insights

  • In-depth market analysis & insights with access to The Smart Investor

Archives

  • Repository of articles and publications dating back to 1997

Ad-free Reading

  • Uninterrupted reading experience with no advertisements

Seamless Access Across All Devices

  • Access Business Standard across devices — mobile, tablet, or PC, via web or app

Topics :technical analysistechnical chartsBuzzing stocks

Next Story