Wipro, HCL Tech, Tech Mahindra: Look at these key levels before investing

Though the Nifty IT index is currently trading above the trendline resistance of 15,010 and the 100-DMA of 14,884, only a strong close with subsequent follow-up buying can lead to a strong breakout.

Technology, stock markets
Avdhut Bagkar Mumbai
Last Updated : Jan 25 2019 | 12:38 PM IST
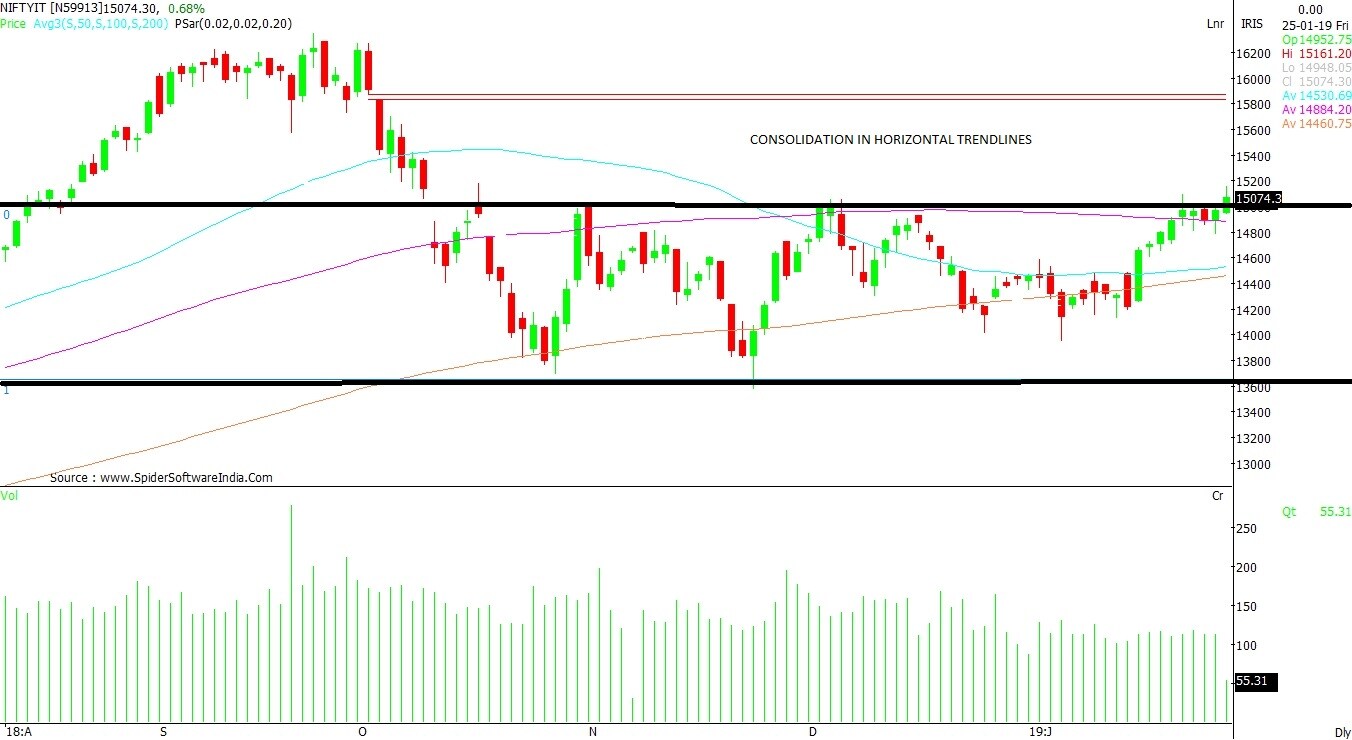
NIFTY IT Index: As per the daily chart, NiftyIT index is showing consolidation in the range of 15,010 – 13,800 on a closing basis. The 100-days moving average (DMA) is currently placed at 14,884 lavels. The index has support at its 200-days moving average (DMA), currently located at 14,460 levels. 

Though the index is currently trading above the trendline resistance of 15,010 and the 100-DMA of 14,884, only a strong close with subsequent follow-up buying can lead to a stronger breakout, which can see the index close in on the 15,700 and 15,900 levels, chart suggests. CLICK HERE TO VIEW CHART

Here are key levels of buzzing stocks in the index:

Wipro: The stock has crossed 52-week high of Rs 338 has been in an upward trend. At the current level of Rs 355, the stock looks attractively placed and one can expect more buying to come in. Any dip from the current levels would eventually see accumulation, as 50-DMA and 100-DMA hold a strong support for the stock in the range Rs 330 – Rs 325 levels.

HCL Tech: The stock is trading below 200-DMA placed at Rs 977 level. It has made three attempts to conquer the same average, but failed to achieve the milestone. It is re-attempting to cross the 200-DMA given the two percent jump from yesterday's close of Rs 946 levels. The move seems reliable, as technical indicators RSI (Relative Strength Index) and MACD (moving average convergence and divergence) indicate a strong possibility.

Tech Mahindra: The trendline resistance of Rs 725 has been crossed as per daily chart. The volumes have been subdued despite the rise in stock. The 200-DMA has acted as a strong buying level, currently situated at Rs 695. A bigger time frame (weekly chart) shows a formation that resembles “symmetrical triangle”. If the stock is able to stabilise above Rs 710 for another week, there are chances that it will trend higher thereafter, charts suggest.

One subscription. Two world-class reads.

Already subscribed? Log in

Subscribe to read the full story →
*Subscribe to Business Standard digital and get complimentary access to The New York Times

Smart Quarterly

₹900

3 Months

₹300/Month

SAVE 25%

Smart Essential

₹2,700

1 Year

₹225/Month

SAVE 46%
*Complimentary New York Times access for the 2nd year will be given after 12 months

Super Saver

₹3,900

2 Years

₹162/Month

Subscribe

Renews automatically, cancel anytime

Here’s what’s included in our digital subscription plans

Exclusive premium stories online

  • Over 30 premium stories daily, handpicked by our editors

Complimentary Access to The New York Times

  • News, Games, Cooking, Audio, Wirecutter & The Athletic

Business Standard Epaper

  • Digital replica of our daily newspaper — with options to read, save, and share

Curated Newsletters

  • Insights on markets, finance, politics, tech, and more delivered to your inbox

Market Analysis & Investment Insights

  • In-depth market analysis & insights with access to The Smart Investor

Archives

  • Repository of articles and publications dating back to 1997

Ad-free Reading

  • Uninterrupted reading experience with no advertisements

Seamless Access Across All Devices

  • Access Business Standard across devices — mobile, tablet, or PC, via web or app

Next Story