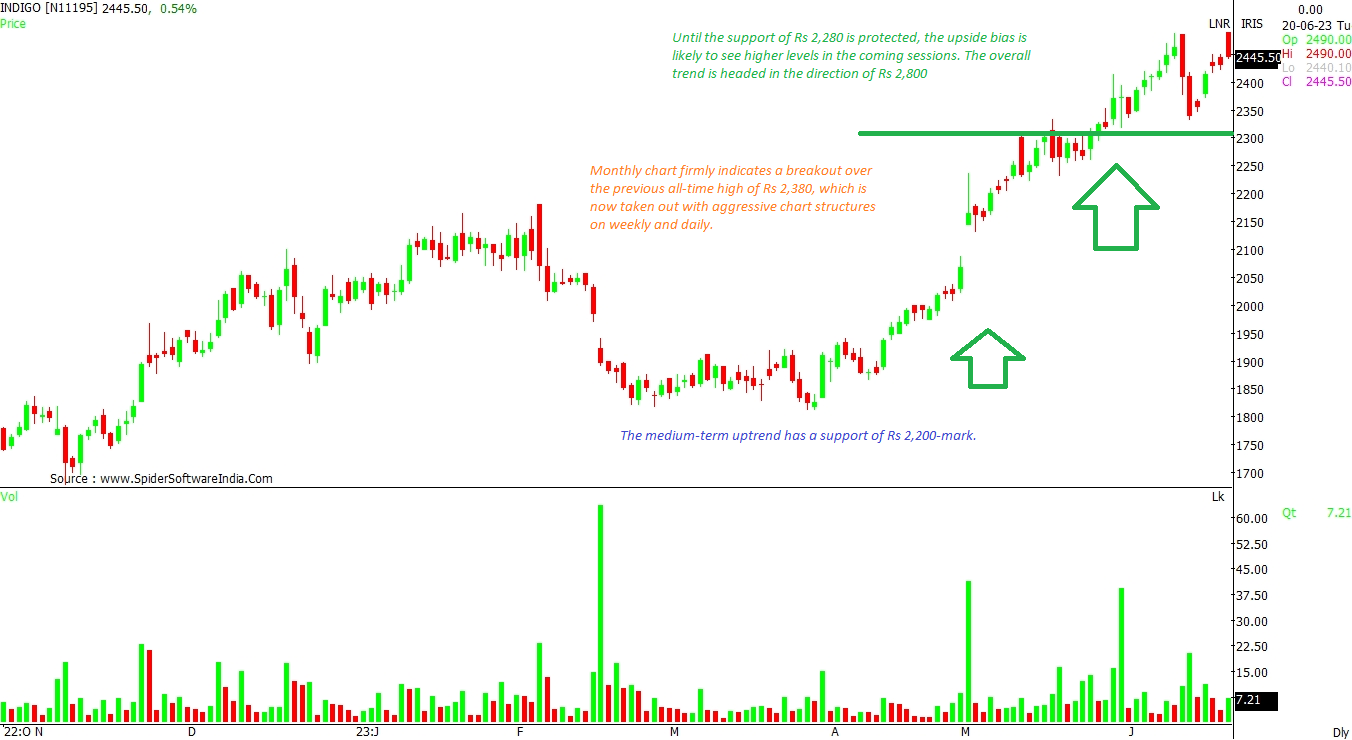
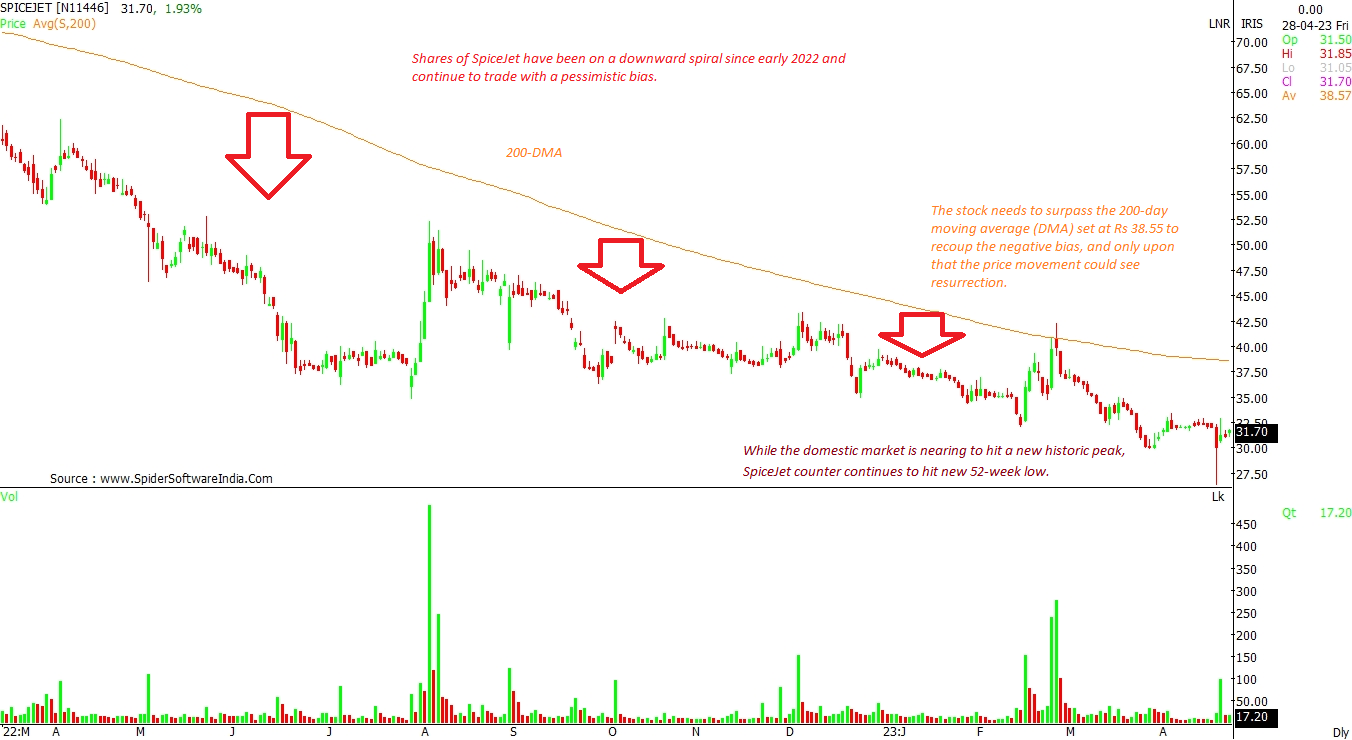
IndiGo stock may rally to Rs 2,800, SpiceJet remains sluggish on charts
Technical chart of InterGlobe Aviation appears promising, with price action heading towards Rs 2,800. SpiceJet remains underperformer.
 "IndiGo stock may rally to Rs 2,800, SpiceJet remains sluggish on charts")
premium
Explore Business Standard
Technical chart of InterGlobe Aviation appears promising, with price action heading towards Rs 2,800. SpiceJet remains underperformer.
Already subscribed? Log in
Subscribe to read the full story →
3 Months
₹300/Month
1 Year
₹225/Month
2 Years
₹162/Month
Renews automatically, cancel anytime

Over 30 premium stories daily, handpicked by our editors


News, Games, Cooking, Audio, Wirecutter & The Athletic
Digital replica of our daily newspaper — with options to read, save, and share


Insights on markets, finance, politics, tech, and more delivered to your inbox
In-depth market analysis & insights with access to The Smart Investor


Repository of articles and publications dating back to 1997
Uninterrupted reading experience with no advertisements


Access Business Standard across devices — mobile, tablet, or PC, via web or app
First Published: Jun 20 2023 | 11:11 AM IST