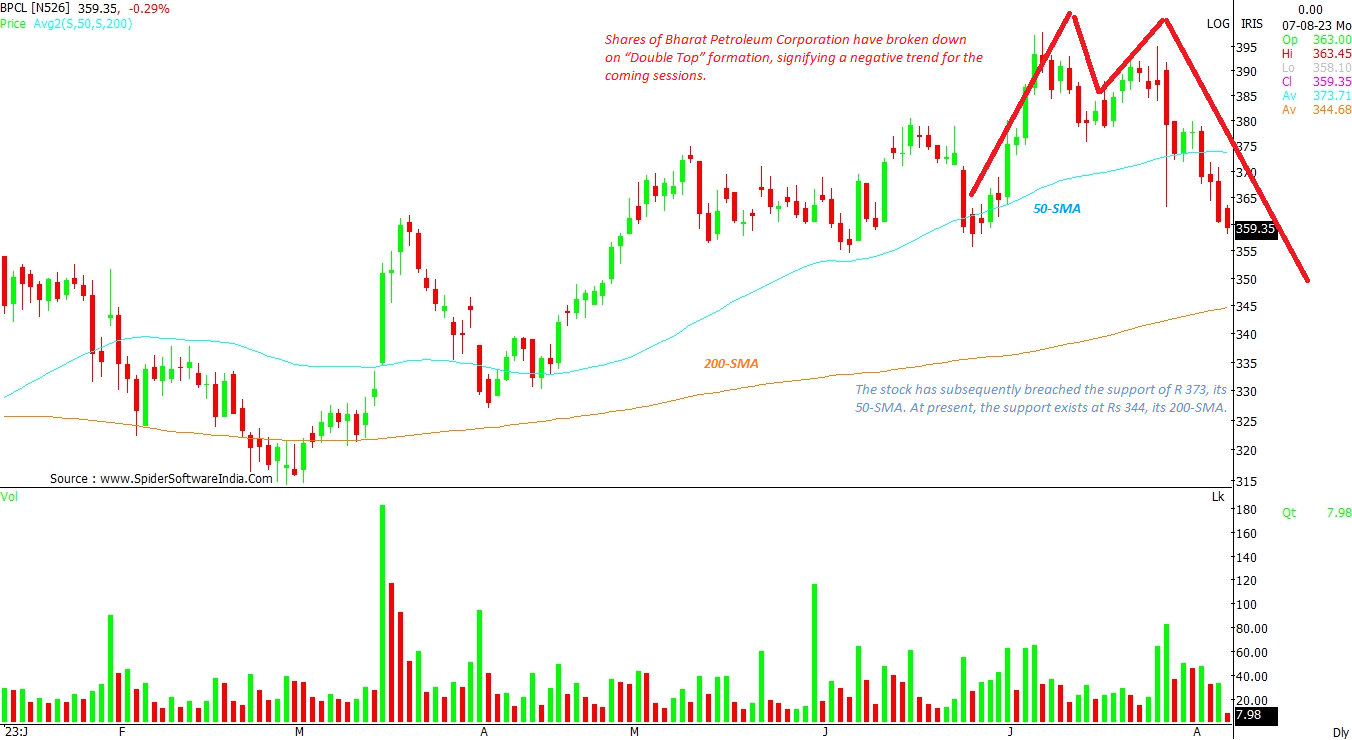
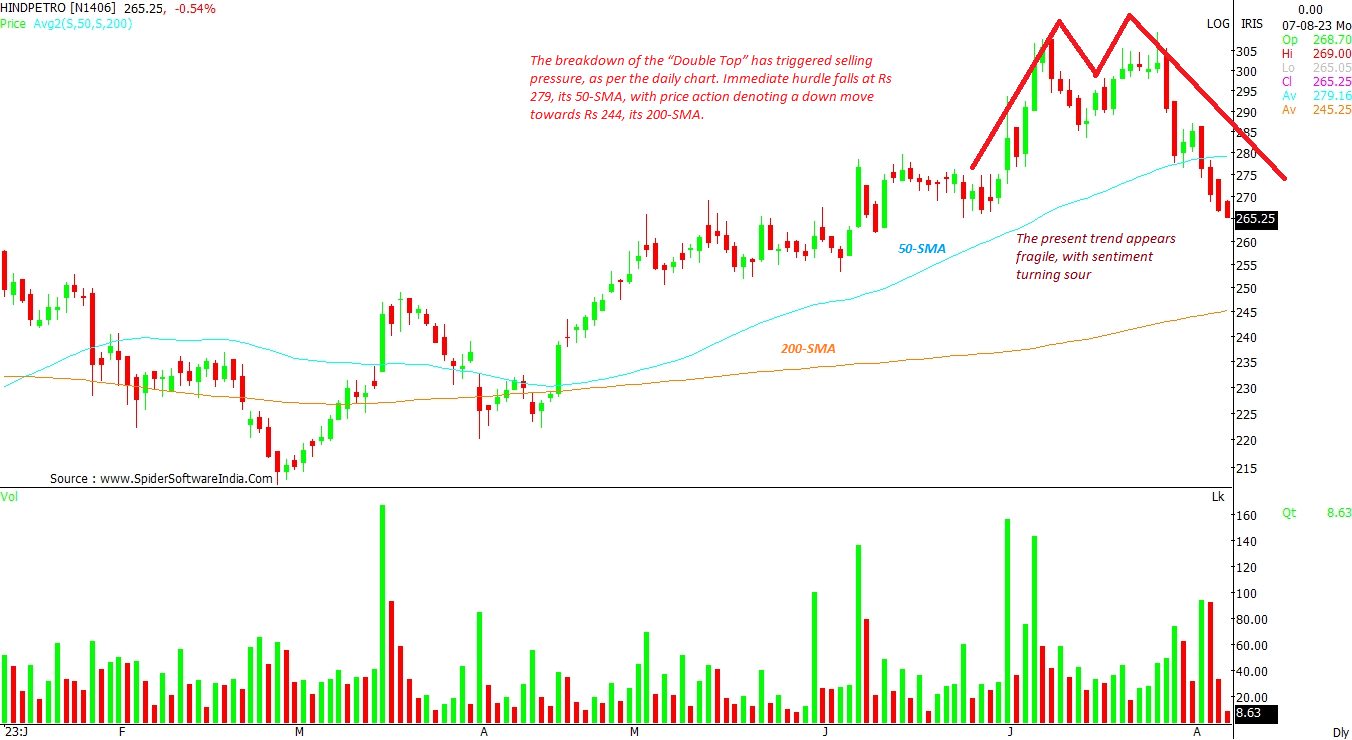
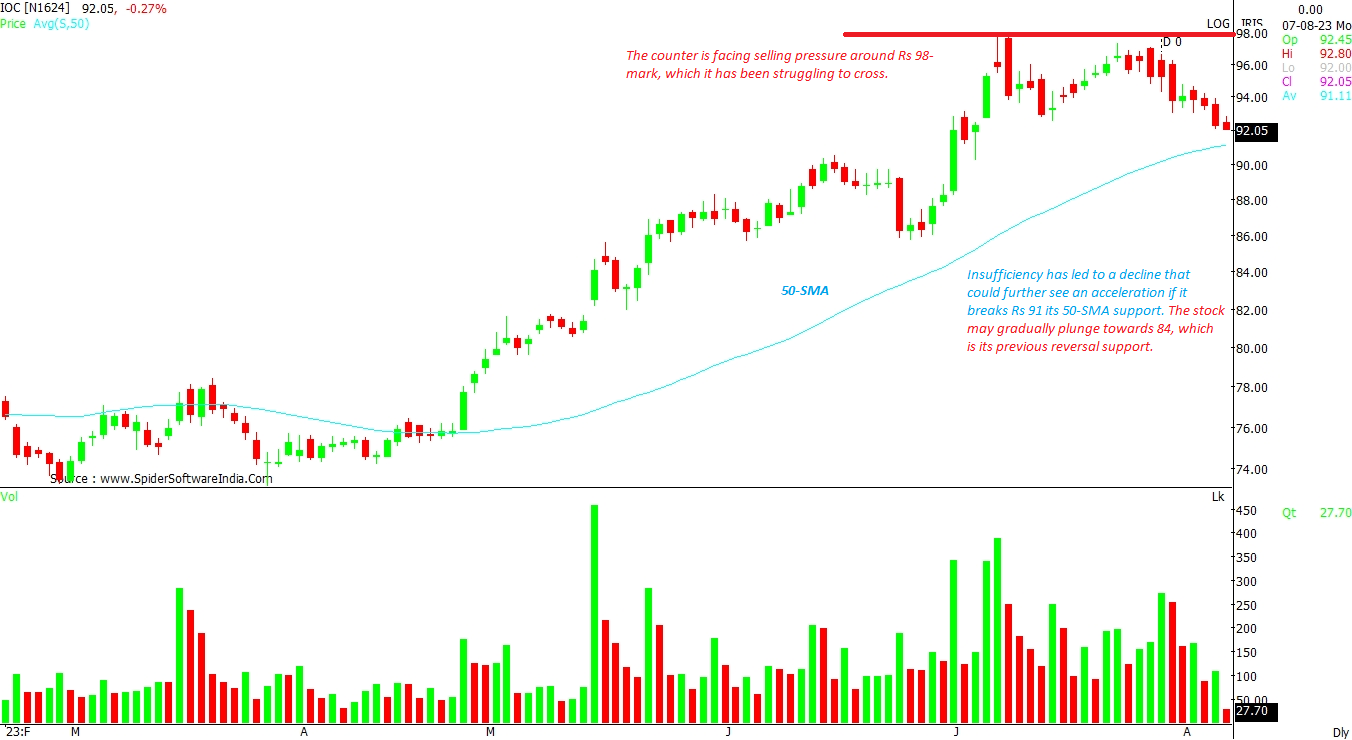
Bears may tighten grip on OMC stocks as Crude Oil trades at 6-week high

OMC stocks are displaying bearish sentiment, if fails to hold key supports then could enter medium-term selling bias.

oil, export, trade, crude oil,
OMC stocks are under pressure
Avdhut Bagkar Mumbai
2 min read Last Updated : Aug 07 2023 | 11:43 AM IST
Oil prices surged for the 6-consectuive week, climbing a 3-month high post displaying a strong accumulation near $70 per barrel from March to June of this year. 

This is the sharpest and straight up jump the Brent Crude has observed following an intense sell-off since March 2022. Technically, a breakout over $90 could accelerate the next move to $100 per barrel. 

Rise in crude oil inversely affects OMC stocks, with Bharat Petroleum Corporation, Hindustan Petroleum Corporation, and Indian Oil Corporation have been on a downward spiral since last few sessions. 

Here’s the technical outlook of OMC stocks amid rise in crude oil prices:-

Nifty Oil and Gas Index (NIFTYOILAN) 
Otlook: support at 200-SMA

While the oil index appears to be in a bullish bias, post breaking out of the 200-day simple moving average (SMA) displaying a robust move, the immediate breach of the trend line support has hindered the positive trend.  The support stays at Rs 7,767-level, its 200-SMA. Going forward, stability over the 8,000 mark could recoup the losing strength. CLICK HERE FOR THE CHART

Bharat Petroleum Corporation Ltd (BPCL)
Outlook: Heading towards 200-SMA

Shares of Bharat Petroleum Corporation have broken down on “Double Top” formation, signifying a negative trend for the coming sessions. The stock has subsequently breached the support of R 373, its 50-SMA. At present, the support exists at Rs 344, its 200-SMA. CLICK HERE FOR THE CHART

Hindustan Petroleum Corporation Ltd (HINDPETRO)
Outlook: Heading towards 200-SMA

The breakdown of the “Double Top” has triggered selling pressure, as per the daily chart. Immediate hurdle falls at Rs 279, its 50-SMA, with price action denoting a down move towards Rs 244, its 200-SMA. The present trend appears fragile, with sentiment turning sour.  CLICK HERE FOR THE CHART

Indian Oil Corporation Ltd (IOC)
Outlook: Support of 50-SMA

The counter is facing selling pressure around Rs 98-mark, which it has been struggling to cross. Insufficiency has led to a decline that could further see an acceleration if it breaks Rs 91 its 50-SMA support. The stock may gradually plunge towards 84, which is its previous reversal support. CLICK HERE FOR THE CHART

One subscription. Two world-class reads.

Already subscribed? Log in

Subscribe to read the full story →
*Subscribe to Business Standard digital and get complimentary access to The New York Times

Smart Quarterly

₹900

3 Months

₹300/Month

SAVE 25%

Smart Essential

₹2,700

1 Year

₹225/Month

SAVE 46%
*Complimentary New York Times access for the 2nd year will be given after 12 months

Super Saver

₹3,900

2 Years

₹162/Month

Subscribe

Renews automatically, cancel anytime

Here’s what’s included in our digital subscription plans

Exclusive premium stories online

  • Over 30 premium stories daily, handpicked by our editors

Complimentary Access to The New York Times

  • News, Games, Cooking, Audio, Wirecutter & The Athletic

Business Standard Epaper

  • Digital replica of our daily newspaper — with options to read, save, and share

Curated Newsletters

  • Insights on markets, finance, politics, tech, and more delivered to your inbox

Market Analysis & Investment Insights

  • In-depth market analysis & insights with access to The Smart Investor

Archives

  • Repository of articles and publications dating back to 1997

Ad-free Reading

  • Uninterrupted reading experience with no advertisements

Seamless Access Across All Devices

  • Access Business Standard across devices — mobile, tablet, or PC, via web or app

Topics :OMCs HPCLOMC stocksOMCs BPCLstock market tradingstock market rallyStock movemnetstock market listingstock market betsstock market investingstock market bullsIndian stock marketCrude Oil PriceBrent crude oilChart Readingstocks technical analysistechnical analysisMarket technicalstechnical charts

Next Story