Max Financial Services (MFSL), Hitachi Energy India (NSE Code: PowerIndia) and Solar Industries India are the 3 midcap stocks on the NSE, to witness a breakout on the technical charts on Friday.
Technical chart shows, that each of these 3 stocks - MFSL, Hitachi Energy and Solar Industries - were seen trading above the higher-end of the Bollinger Bands on the daily scale in intra-day trades on Friday, May 23, 2025.
In general, stocks quoting above the higher-end of the Bollinger Bands continue to extend gains as long as they manage to sustain above the same.
Follow Stock Market Latest Updates Today LIVE Here's a technical outlook on these 3 Nifty Midcap stocks:
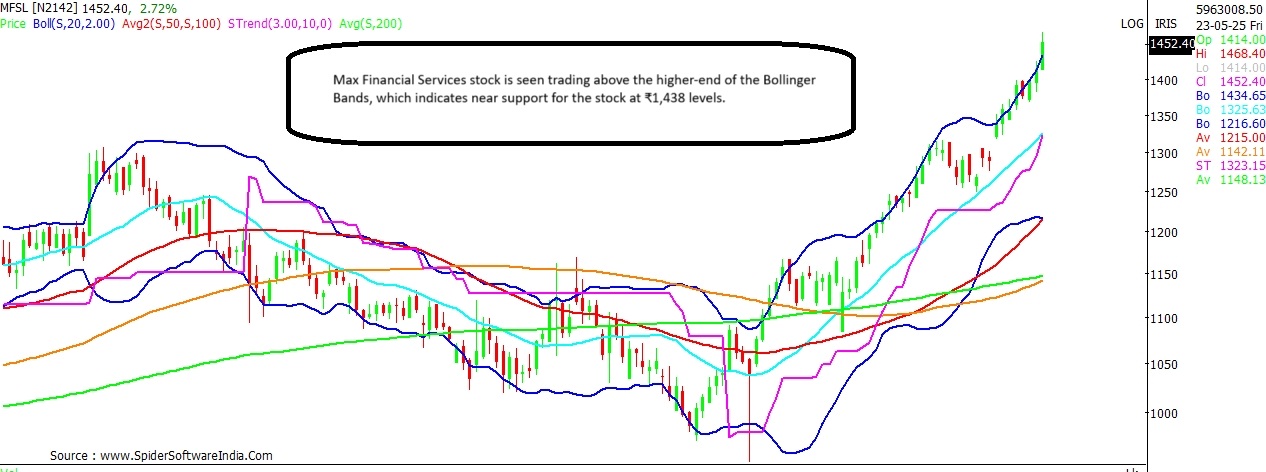
Max Financial Services (MFSL)
Current Price: ₹1,465
Upside Potential: 6.9%
Support: ₹1,438; ₹1,398; ₹1,369
Resistance: ₹1,470
Apart from the daily chart,
MFSL stock is seen trading above the Bollinger Bands across time-frames, including the weekly and monthly charts. The near-term bias for the stock is likely to remain upbeat note as long as it trades above ₹1,438. The medium and long-term chart shows presence of bullish pivot at ₹1,398 and ₹1,369 levels.
On the upside, the stock can potentially rally to ₹1,566 levels, with some resistance seen around present levels at ₹1,470.
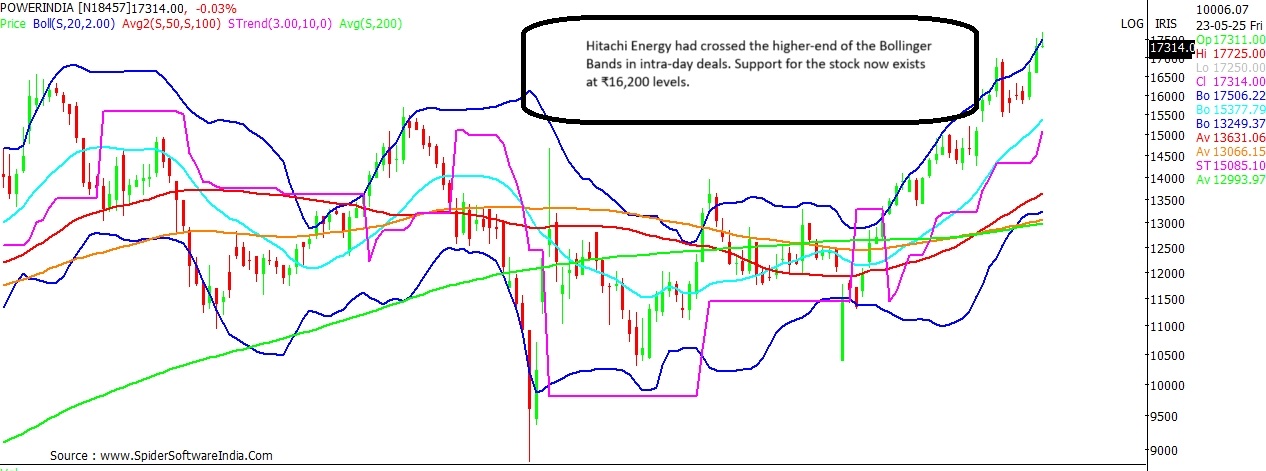
CLICK HERE FOR THE CHART ALSO READ | How much upside can ITC stock see post Q4 results? Find out here Hitachi Energy India (NSE Code: PowerIndia)
Current Price: ₹17,370
Upside Potential: 23.5%
Support: ₹17,100; ₹16,200
Resistance: ₹18,765; ₹20,100
At the day's high of ₹17,725,
Hitachi Energy stock was seen trading above the higher-end of the Bollinger Bands on the daily scale. The weekly chart indicates that the bias for the stock is likely to remain favourable as long as the stock holds above ₹16,200 levels, with near support likely around ₹17,100.
On the upside, the stock can potentially rally to ₹21,450 levels. On its way up, Hitachi Energy stock could face intermediate resistance around ₹18,765 and ₹20,100 levels.
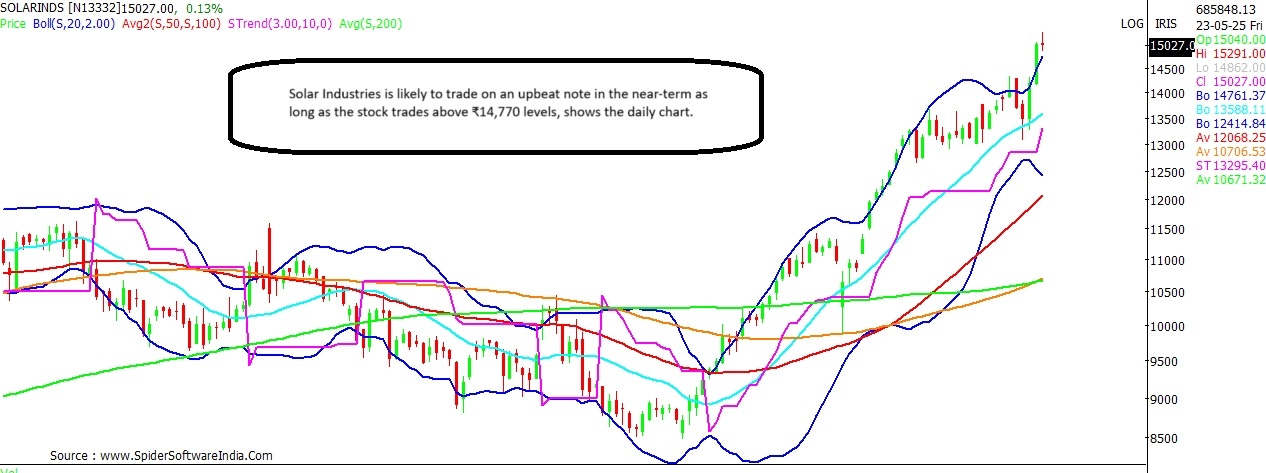
CLICK HERE FOR THE CHART ALSO READ | This BSE500 stock zooms 101% in 4 months; hits new peak in weak market Solar Industries India
Current Price: ₹15,049
Upside Potential: 11.6%
Support: ₹14,770; ₹14,650; ₹14,240
Resistance: ₹15,260
Solar Industries, too, is seen trading on a buoyant note above the higher-end of the Bollinger Bands across time-frames. Chart indicates near support for the stock at ₹14,770 levels followed by ₹14,650 and ₹14,240 levels. On the upside, the stock can spurt to ₹16,800 levels, with some resistance likely around ₹15,260 levels.
CLICK HERE FOR THE CHART  "Breakout stocks! Max Financial, Hitachi, Solar Inds may rally up to 23%")


