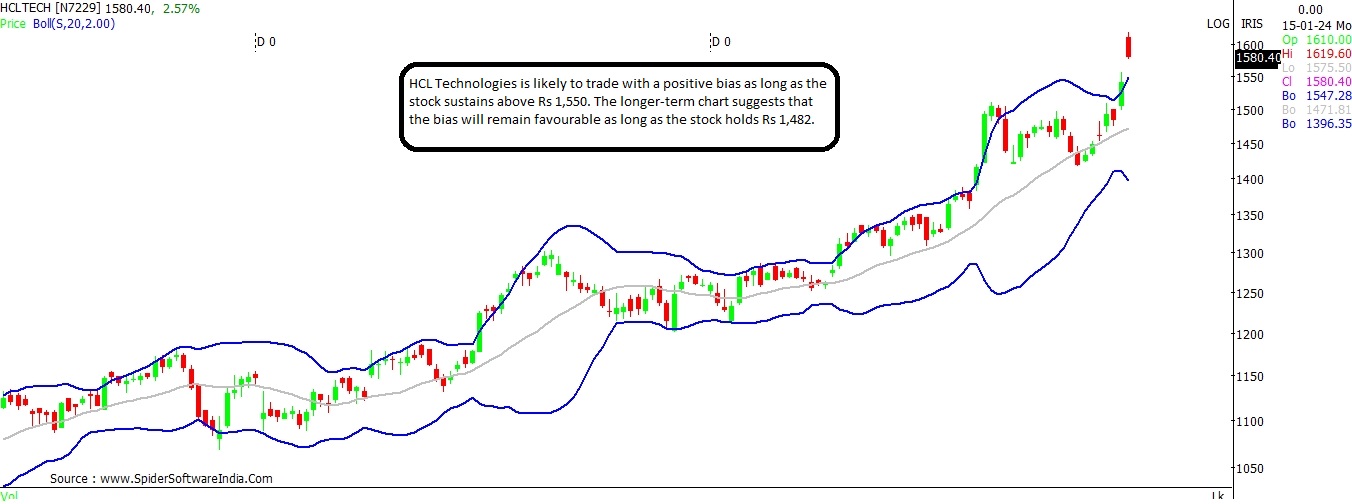
Infy, TCS, Wipro, HCLT: Chart suggests up to 14% upside as stocks breakout
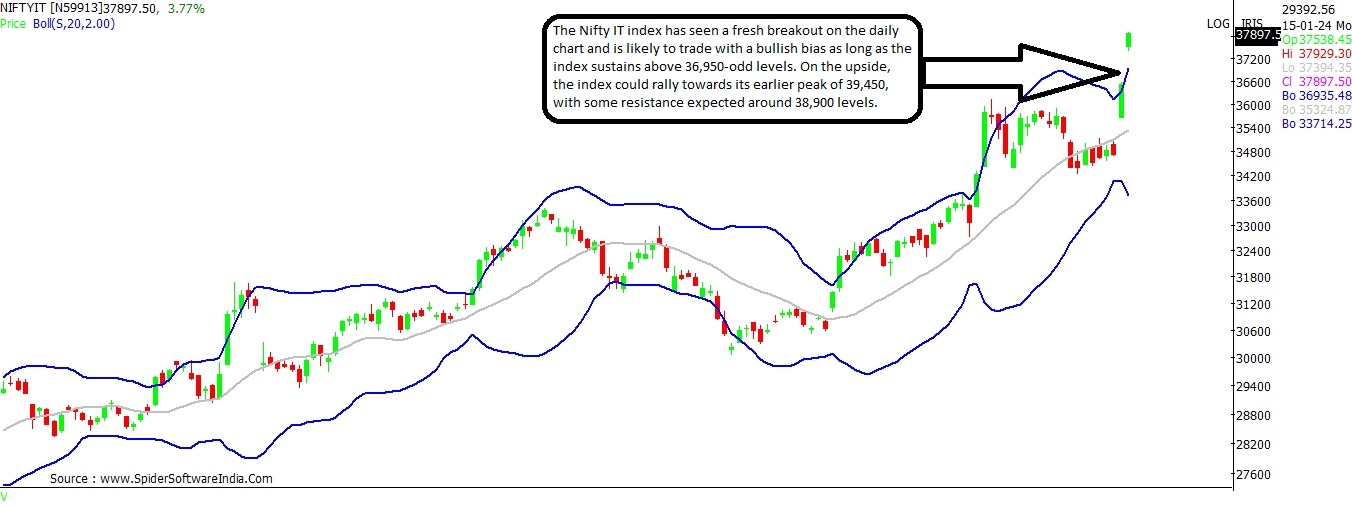
The Nifty IT index is likely to trade with a bullish bias as long as the index sustains above 36,950 levels, suggest the daily chart.
 "Infy, TCS, Wipro, HCLT: Chart suggests up to 14% upside as stocks breakout")
premium
Explore Business Standard
Associate Sponsors
Co-sponsor
The Nifty IT index is likely to trade with a bullish bias as long as the index sustains above 36,950 levels, suggest the daily chart.
Already subscribed? Log in
Subscribe to read the full story →
3 Months
₹300/Month
1 Year
₹225/Month
2 Years
₹162/Month
Renews automatically, cancel anytime

Over 30 premium stories daily, handpicked by our editors


News, Games, Cooking, Audio, Wirecutter & The Athletic
Digital replica of our daily newspaper — with options to read, save, and share


Insights on markets, finance, politics, tech, and more delivered to your inbox
In-depth market analysis & insights with access to The Smart Investor


Repository of articles and publications dating back to 1997
Uninterrupted reading experience with no advertisements


Access Business Standard across devices — mobile, tablet, or PC, via web or app
First Published: Jan 15 2024 | 11:32 AM IST
