Home / Markets / News / Markets in a free fall. More pain ahead? Here's what charts suggest
Markets in a free fall. More pain ahead? Here's what charts suggest
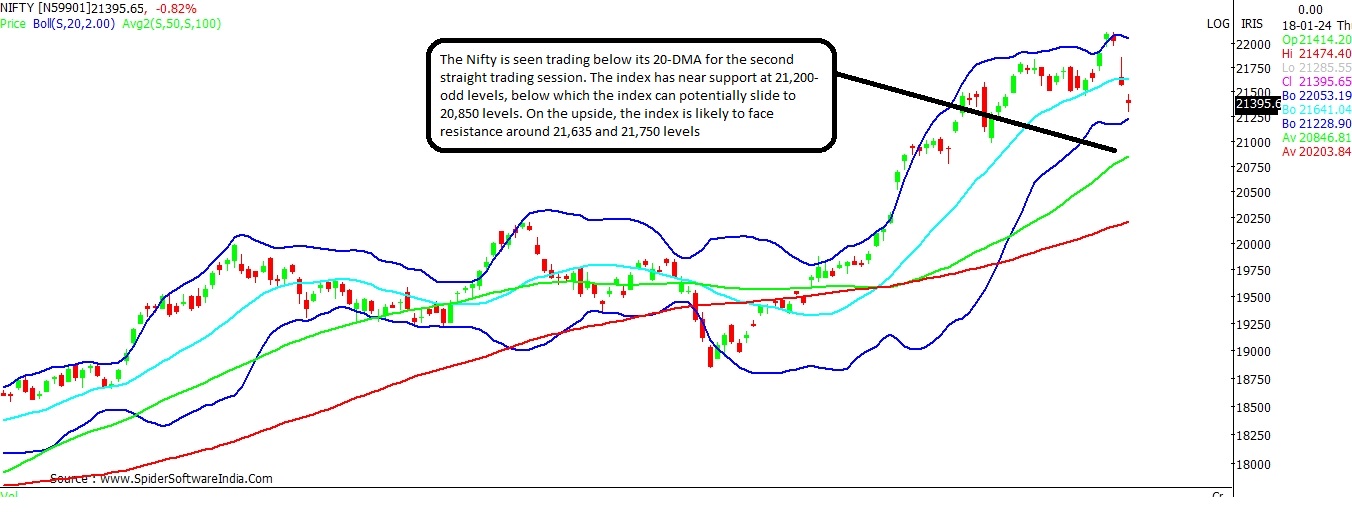
The Nifty has declined over 3 per cent in the last two trading sessions, and is seen trading below its 20-DMA for the first time since November 07, 2023.
3 min read Last Updated : Jan 18 2024 | 12:16 PM IST
Markets have been in a free fall since the last two trading sessions with the S&P BSE Sensex and the Nifty50 slipping 3.5 per cent and 3.1 per cent, respectively.
Although Wednesday's market movement was mostly driven by banking stocks that have a weightage of around 35 per cent in the index, primarily HDFC Bank with approximately 14 per cent weightage, Sameet Chavan, technical analyst at Angel One suggests that it is advisable to not regard this as a one-day move.
"Participants should avoid getting overly bearish and refrain from chasing momentum to the downside," he suggests.
At the fundamental level, however, V K Vijayakumar, chief investment strategist at Geojit Financial Services suggests that investors can use any further dips in HDFC Bank to buy the stock from a long-term perspective.
The overall sell-off in the markets, he said, was also partly triggered by weak global cues, especially in the Asian and emerging markets (EMs).
The FPI sell figures in India on Wednesday were Rs 10,578 crore. In the context of rising bond yields in the US, FPIs, analysts believe, may continue to sell. In the Indian context, however, DII buying in fairly valued large-caps with growth potential may lend some stability to the markets.
"At elevated valuations, the market needs only a trigger for a sell-off. On Wednesday, this trigger came in the form of HDFC Bank’s worse-than-expected results. It is also important to understand that there was a sell-off in other EMs like Taiwan and Korea, indicating that this is an EM correction driven by FPI outflows. Investors may wait and watch for this turbulence to subside. The resilience in IT stocks in this crash is an indication of the strength of the sector. Apart from IT, large caps like RIL, ICICI Bank, L&T and Bharti have strength to tide over this turbulence," Vijayakumar said.
Meanwhile, here are the key levels you should keep a tab on for the Nifty 50 index.
Nifty
Current level: 21,385
Potential downside: 2.5%
Key support: 21,200
Resistance: 21,635; 21,750
With back-to-back heavy losses, the NSE Nifty 50 weekly chart is showing an Engulfing bearish candlestick, with the high and low higher compared to that of the previous week.
Last week's low of 21,450 level needs to be closely tracked on the weekly scale, as a close below the same would suggest likely further correction in the market. Among the key momentum oscillators, the Stochastic Slow has turned negative, while the MACD and Directional Index remain in favour of the bulls.
On the daily scale, the Nifty is trading below its 20-DMA (Daily Moving Average) for the second straight trading session. The index is seen trading below this key level for the first time since November 07, 2023. It has also dipped below its super trend line, and now seems on course to test support at the lower-end of the Bollinger Bands at 21,200-odd levels.
With key momentum oscillators clearly in favour of the bears on the daily scale. Break and sustained trade below 21,200-levels, could see the Nifty slide all the way to 20,850-odd levels, wherein stands the 50-DMA.
On its way up, the index is likely to face resistance around its 20-DMA at 21,635, above which the next hurdle would be around 21,750. CLICK HERE FOR THE CHART