The Nifty 50, on Tuesday, broke below its 50-DMA (Daily Moving Average) for the first time in the last four months, thus in a way signaling that that the short-term trend may have reversed for the NSE benchmark.
As the Nifty quoted below its 50-DMA as many 33 out of the Nifty 50 components were seen trading below their respective 50-DMAs. Among these 10 shares - Adani Ports, BPCL, HCL Technologies, Nestle, Power Grid Corporation, Reliance Industries, SBI Life, Tata Consumer Products, TCS and Wipro slipped below the key moving average yesterday.
Broadly speaking, with 3 out of 3 Nifty 50 stocks now quoting below their short-term moving averages, underscores the nervousness in the broader market mood.
Meanwhile, here's a quick guide on key levels to watch out on the Nifty 50 and select stocks going ahead.
Resistance: 22,180; 22,350
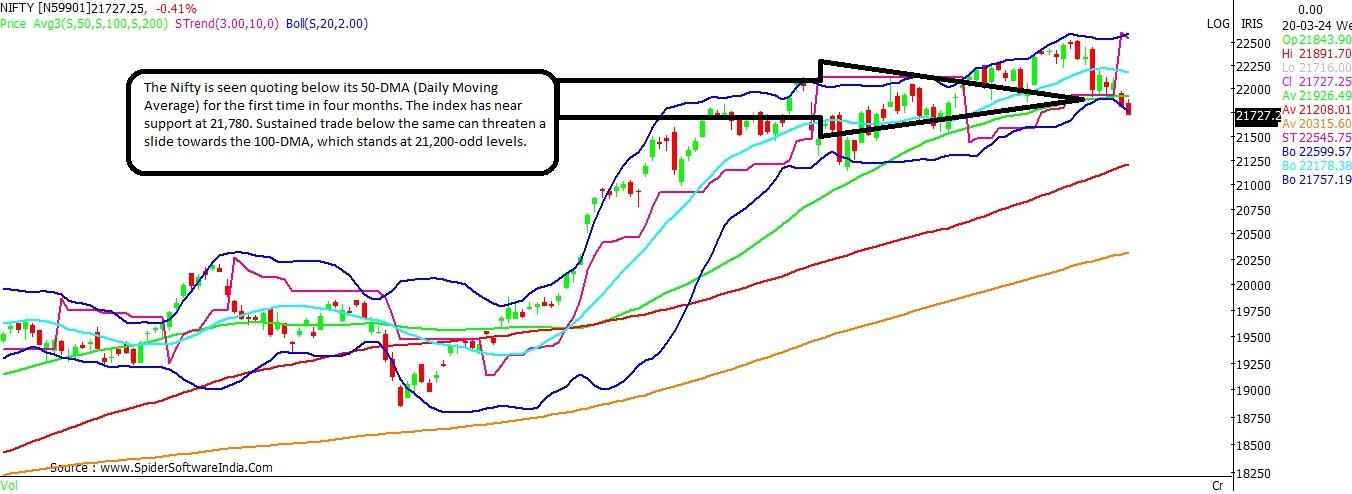
The Nifty 50 is presently quoting marginally below its 50-DMA, which stands at 21,930. More importantly, the NSE benchmark has broken the trend line support, which further indicates that the index may witness a lower high, lower low trend going ahead.
Having said that, sustained trade below the lower-end of the anticipated trading band, i.e. 21,780 levels, can trigger a slide towards the 100-DMA, which stands at 21,200 levels, shows the daily chart.
CLICK HERE FOR THE CHART Going ahead, the 20-DMA at 22,180-odd level followed by 22,350 is likely to act as resistance for the Nifty 50.
Resistance: Rs 570; Rs 620
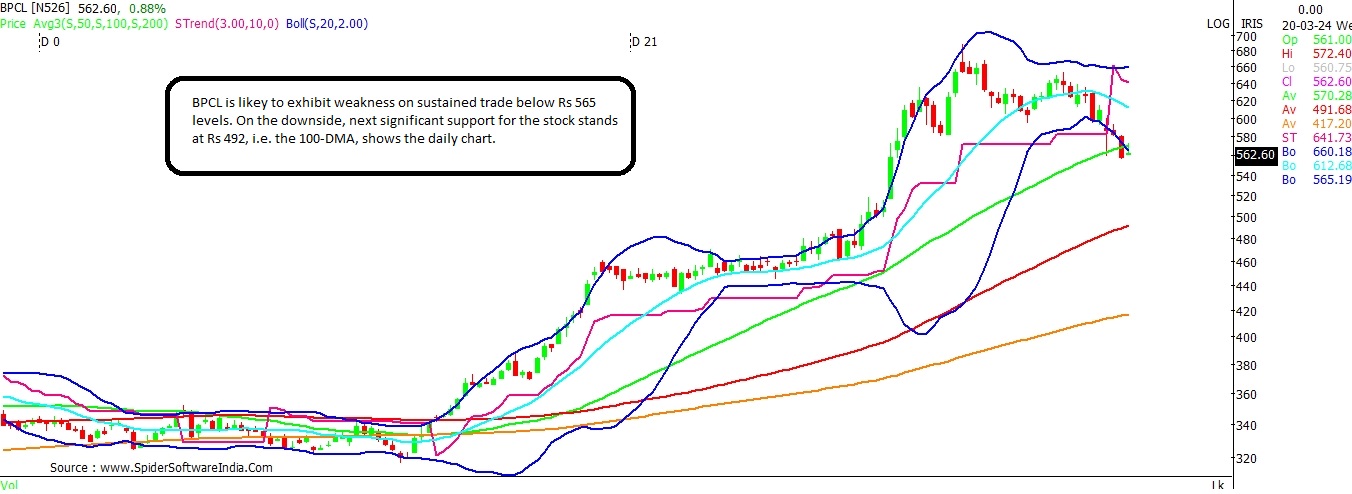
BPCL has declined 16 per cent from its high of Rs 668 in mid-February. Chart suggests that the near term bias is likely to remain weak as long as the stock trades below Rs 566. On the downside, the stock may test its 100-DMA at Rs 492.
CLICK HERE FOR THE CHART On the other hand, in case, the stock pullbacks and manages to consolidate around its 50-DMA, which stands at Rs 570. The stock may bounce back to Rs 620-odd levels.
Support: Rs 2,502; Rs 2,490; Rs 2,360
Resistance: Rs 2,550; Rs 2,600
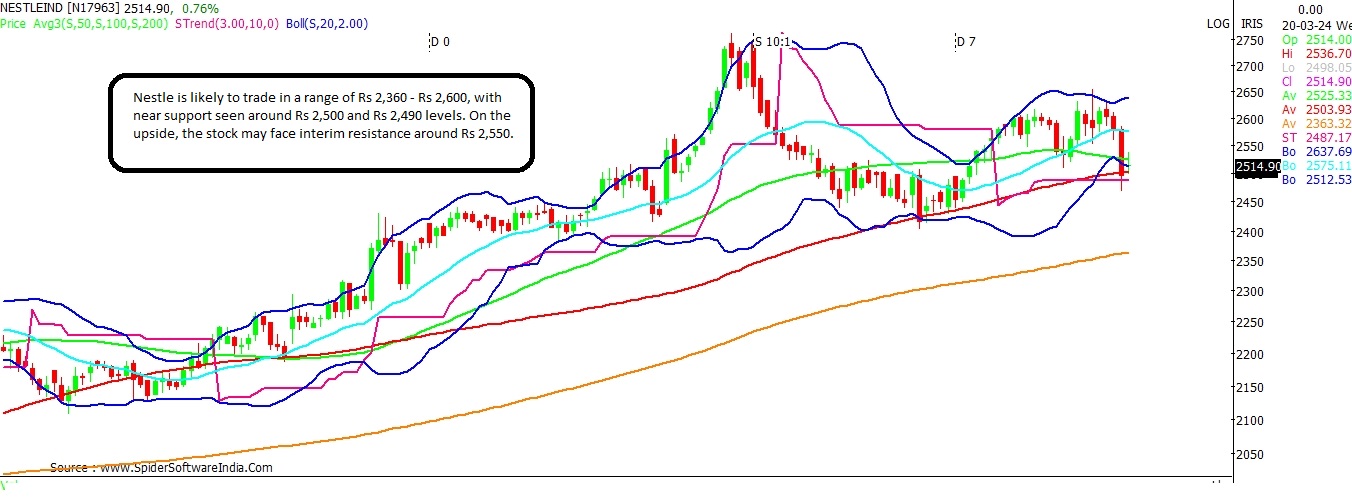
Shares of Nestle India seem to be interestingly placed on the charts, with the stock dipping below the 50-DMA at Rs 2,527, and find support around the 100-DMA and trend line around Rs 2,502 and Rs 2,490, respectively.
CLICK HERE FOR THE CHART The daily chart suggests, that the stock may trade in the broad range of Rs 2,360 - Rs 2,600 in the near-term, with 200-DMA at the lower end as the major support, and 20-DMA around Rs 2,550 as an interim resistance.
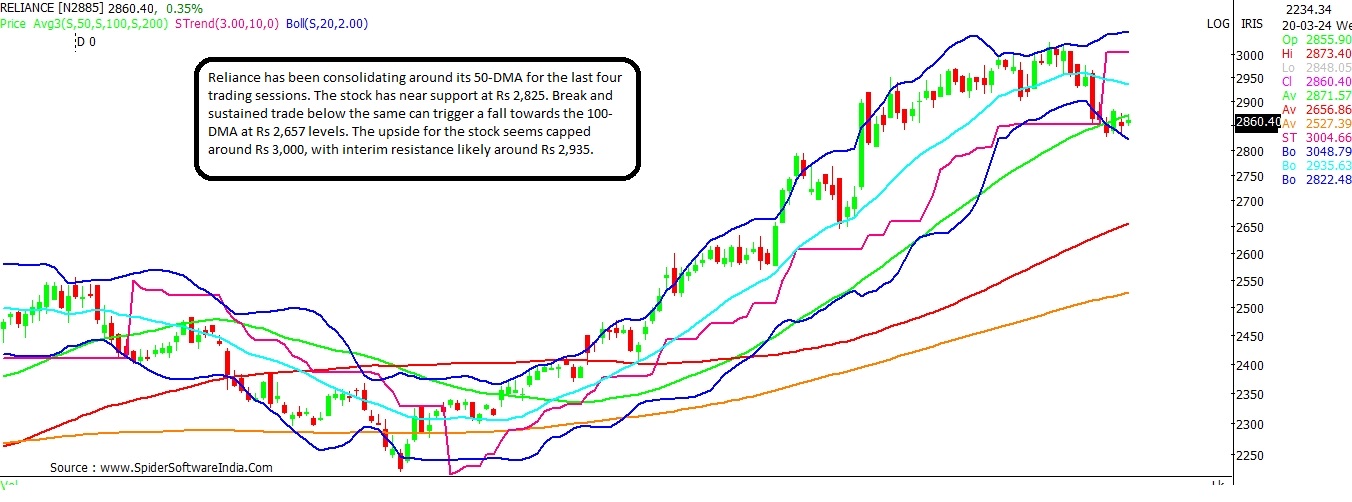
Support: Rs 2,825; Rs 2,657
Resistance: Rs 2,935; Rs 3,000
Reliance is the major index heavyweight and tends to lead the market trajectory more often than not. Since the last four trading sessions, Reliance is seen floating around its 50-DMA at Rs 2,870 levels.
The daily chart suggests presence of near support around Rs 2,825 levels. Sustained trade below the same could be worrisome, as that could suggest a potential downside risk up to Rs 2,657-odd levels, wherein the 100-DMA stands.
CLICK HERE FOR THE CHART For now, upside for the stock seems to be capped around the Rs 3,000-mark, with interim resistance expected around its 20-DMA at Rs 2,935.
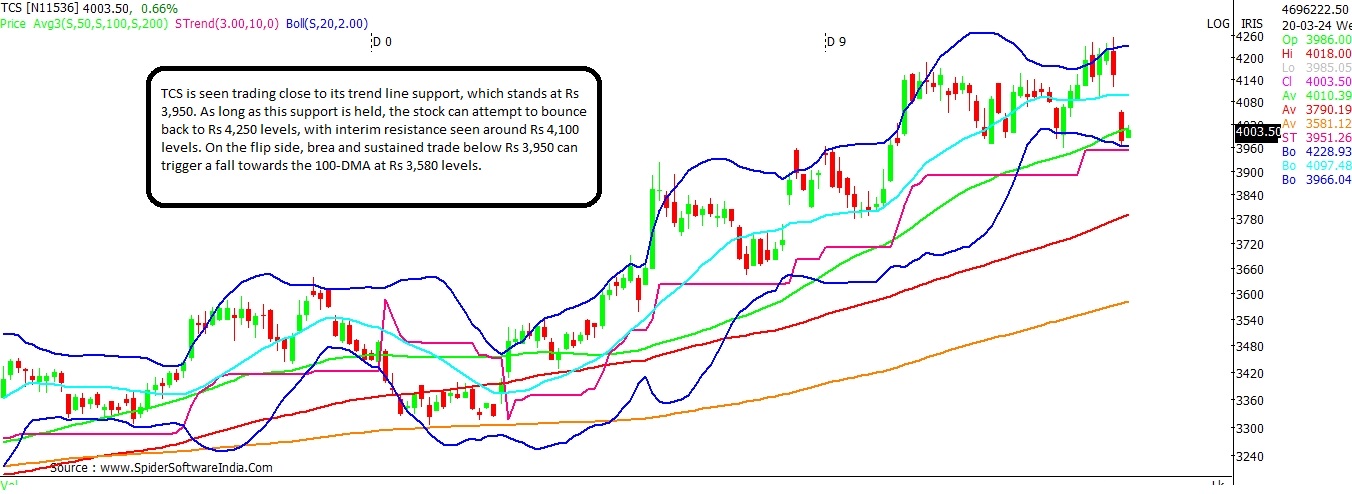
Support: Rs 3,950; Rs 3,580
Resistance: Rs 4,100; Rs 4,250
The gap-down trade on Tuesday, saw TCS dip below its 50-DMA for the first time since November 2023. Even as the stock slipped below its 50-DMA (Rs 4,004), it still holds above the trend line support, which stands at Rs 3,950.
CLICK HERE FOR THE CHART The near-term bias for the stock is likely to remain cautiously optimistic as long as the trend line support is held. On the upside, the stock needs to pullback above its 20-DMA at Rs 4,100 level, in order to regain strength. On the upside, the stock may scale back to Rs 4,250-odd levels.
 "RIL, BPCL: Nifty below 50-DMA; Key levels to watch on stocks below this DMA")


