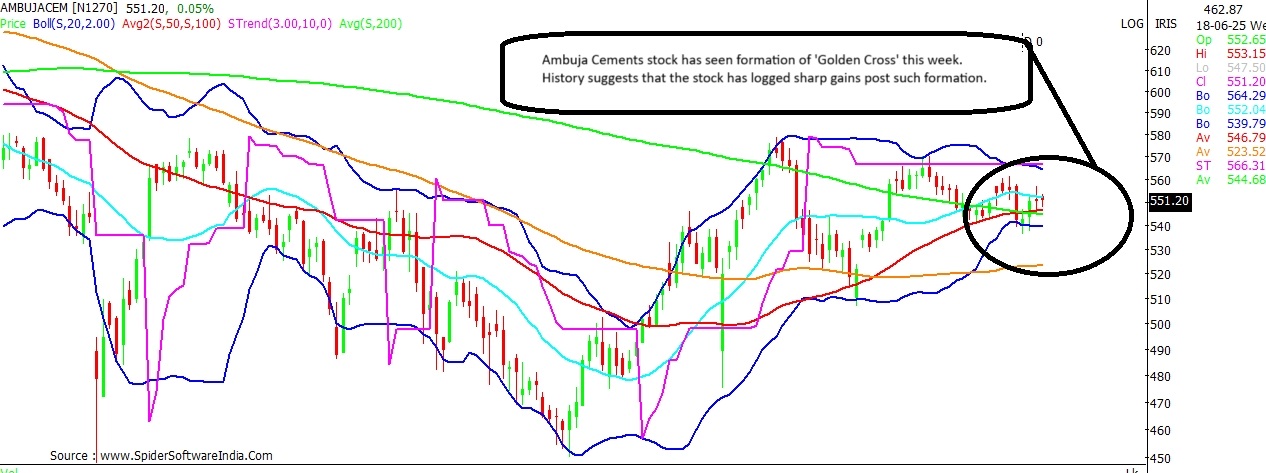
Ambuja Cements, an Adani-group stock, witnessed formation of 'Golden Cross' also commonly known as 'Golden Crossover' on the daily chart this week.
Technically, a 'Golden Cross' formation or a 'Golden Crossover' means that the underlying stock's 50-Day Moving Average (50-DMA) has now crossed over the long-term 200-DMA from below. The 50-DMA of Ambuja Cements now stands at ₹546.40, while the 200-DMA at ₹544.90.
CLICK HERE FOR THE CHART In general, Golden Crossover is considered as a positive sign for the underlying stock, as the short-term (50-Day) moving average now trades above the long-term moving average (200-DMA) and tends to provide support on the higher side.
Historical study shows that
Ambuja Cements stock on an average has rallied up to 86 per cent after the 'Golden Cross' formation in the last three instances since the year 2020.
The last Golden Cross formation was witnessed on the Ambuja Cements daily chart on September 5, 2023, post which the stock from levels of ₹435 rallied to a high of ₹699 on July 2, 2024 - a gain of 61 per cent at the highest point in the period between Golden Cross and Death Cross. The latter is the opposite of Golden Cross, wherein the 50-DMA falls below the 200-DMA.
ALSO READ | BSE stock price can crash 19% as Sebi okays expiry day switch Similarly, post a Golden Cross formation on September 22, 2022, the stock from ₹352 surged to a high of ₹588 on December 9, 2022 - a gain of 67 per cent. Prior to which, on July 28, 2020, Ambuja Cements stock witnessed a similar bullish formation, and the stock from levels of ₹185, soared 130 per cent to a high of ₹426 on September 7, 2021.
Can the recent 'Golden Crossover' for Ambuja Cements trigger a similar rally this time around? Here's what the technical chart suggests.
Ambuja Cements
Current Price: ₹551
Upside Potential: 27%
Support: ₹545; ₹524; ₹475
Resistance: ₹570; ₹580; ₹630' ₹650
Technical chart indicates a mixed bias for the Ambuja Cements stock at present, with the daily and weekly chart hinting at a likely tepid bias, while the long-term monthly chart in favour of the bulls.
ALSO READ | HAL vs BEL: One defence stock that is a must-have in your portfolio As per the daily and weekly charts, Ambuja Cements faces a strong resistance zone between ₹566 - ₹570; as long as the stock trades below the same it may face downward pressure again. On the other hand, a breakout above this resistance zone shall open the doors for a likely surge towards ₹700-mark, suggests the long-term chart.
Going ahead, support for the stock can be anticipated around ₹545, ₹524 and ₹475 levels. Whereas, post an upside breakout, the Ambuja Cements stock could face resistance around ₹580, ₹630 and ₹650 levels.
Meanwhile, among other Adani group shares - Adani Ports too witnessed a 'Golden Crossover' earlier on June 3, 2025.
 "This Adani-group stock flags BIG bullish signal; can it double from here?")


