Trend turns favourable for GlaxoSmithKline Pharma, key levels to track
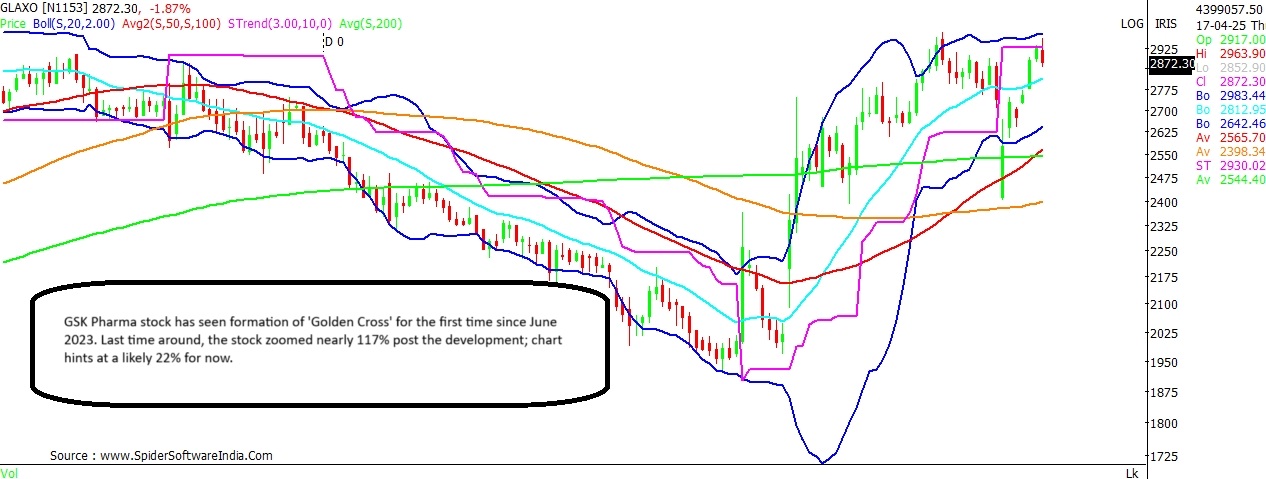
GlaxoSmithKline Pharma stock has seen formation of 'Golden Cross' on the daily chart on Thursday; last time the stock saw a similar development, it rallied almost 117% over the next 14 months.
Rex Cano Mumbai GlaxoSmithKline Pharma, also known as
GSK Pharma, stock has rallied over 22 per cent from its recent low of ₹ 2,401 in the last seven trading sessions. In the process, the stock has swiftly bounced back above its 20-day Daily Moving Average (20-DMA), shows the technical chart.
More importantly, on Thursday April 17, the stock has witnessed the formation of 'Golden Cross' or commonly known as 'Golden Crossover' on the daily charts. The 'Golden Cross' formation means that the 50-DMA of that particular stock or index has crossed over the 200-DMA. This in general implies that the short-term moving average is in ascending angle, thus indicating likely support at higher levels.
Prior to this, GSK Pharma had witnessed formation of 'Death Cross' - which is the opposite of 'Golden Cross' on December 30, 2024, as the 50-DMA slipped below the 200-DMA. Post this negative development, the stock witnessed a 19 per cent fall and eventually bottomed out at ₹ 1,921 in early February.
Historical chart shows that the stock last witnessed a 'Golden Cross' formation on June 30, 2023, wherein the stock price quoted around ₹ 1,415 levels. The stock, thereafter, went on to zoom as much as 116.7 per cent to a high of ₹ 3,067 on August 21, 2024.
ALSO READ: These 2 smallcap stocks trade above 200-DMA after 11 months. Time to buy? Can this present 'Golden Cross' formation trigger a strong bull run for GSK Pharma? Here are the key levels to watch out as the stock turns favourable on charts.
GlaxoSmithKline Pharma (GSK Pharma) Current Price: ₹ 2,873
Upside Potential: 21.8%
Support: ₹ 2,815; ₹ 2,566; ₹ 2,545
Resistance: ₹ 2,930; ₹ 3,045; ₹ 3,180
Even as the stock has seen a 'Golden Crossover', GSK Pharma at present is seen testing resistance around its super trend line on the daily chart at ₹ 2,930. Break and sustained trade above the same shall open the doors for a likely rally towards ₹ 3,180, with some interim resistance around ₹ 3,045 levels. The long-term chart suggests the stock can potentially target ₹ 3,500 levels in the coming months.
For now, the bias for the stock is expected to remain favourable as long as it holds above the 200-DMA which stands at ₹ 2,545 levels. Near support for the stock exists at the 20-DMA at ₹ 2,815; while the 50-DMA is at ₹ 2,566.
CLICK HERE FOR THE CHART  "Trend turns favourable for GlaxoSmithKline Pharma, key levels to track")