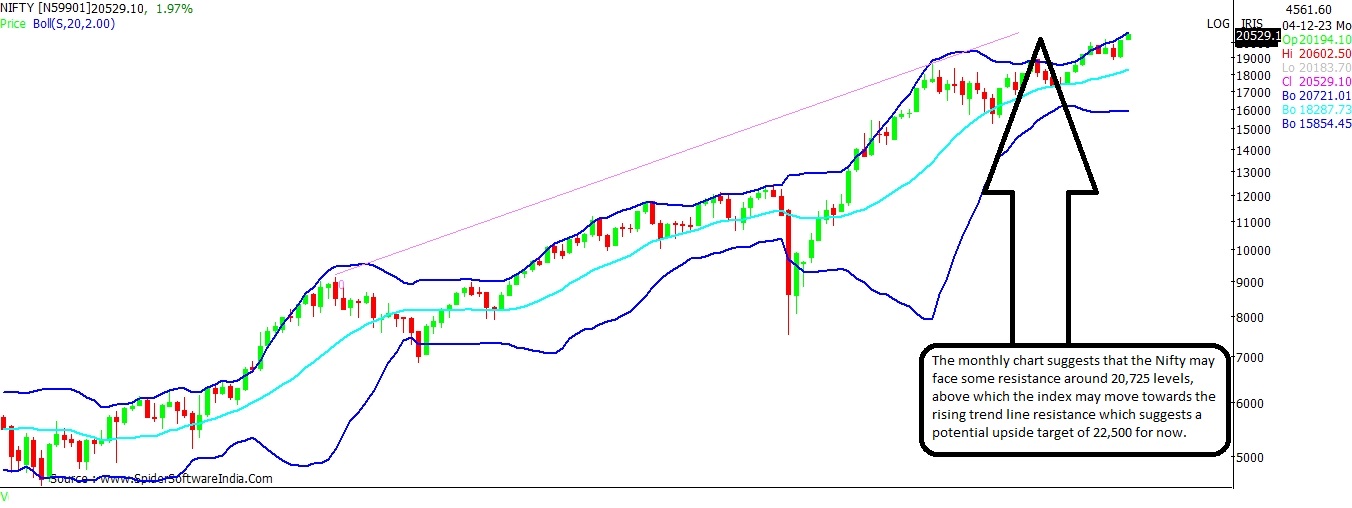
The NSE Nifty has witnessed a strong breakout on the daily and weekly scale following the huge gap-up start of 335 points post a clear verdict in 3 out of 4 state elections in favour of the Bharatiya Janta Party (BJP).
The state elections outcome is seen as a precursor to the general elections next year, in which Narendra Modi-led BJP is eyeing a third-term at the Centre. Analyst says that that market likes political stability.
"The state elections results have turned out to be a big event which can trigger renewed optimism and further rally in the market. Market likes political stability and a reform-oriented, market-friendly government.” said Dr. V K Vijayakumar, Chief Investment Strategist at Geojit Financial Services in a note.
Also read: Will markets extrapolate state poll outcomes to general elections in 2024? That apart, hopes that US Fed rates may have peaked, and a change in interest rate cycle could be expected sooner-than-later have resulted into a sustained drop in US bonds yields. This in turn, could trigger foreign inflows towards Indian stocks, market experts believe.
So far in this calendar year, the Nifty has rallied near about 14 per cent as India's economic growth remained of solid ground despite slowdown in few of the major economies. That apart, steady corporate earnings and rising investor confidence in equity as an asset class has kept the market buoyant.
In terms of landmarks, the Nifty took around 6 years and 3 months to rally from 10,000 to 20,000. The move from 10,000 to 15,000 took around 3 years and 8 months, whereas the rally from 15,000 to 20,000-mark, was completed within 2 years and 8 months.
In per cent age terms, the Nifty soared as much as 50 per cent as it hit the 15,000-mark for the first time ever, while the next 5,000-point gain resulted into a 33.3 per cent rally. As and when the Nifty hits the 25,000-mark, the gain could be 25 per cent from the 20,000-mark.
It may be recalled that in the run-up to the 2019 elections, the Nifty had rallied over 7 per cent in the first three months of the calendar year 2019.
Meanwhile, technically here's how the Nifty seems placed on the chart.
As of now, the daily and weekly chart shows that the Nifty has created a gap at an all-time high levels, which is in between 20,291 and 20,508. The index in future may come down to fill this gap.
But for now, the bias is likely to remain fairly bullish as long as Nifty holds the day's low 20,508. Further, the Bollinger Bands on the daily and weekly scale indicate likely support for the Nifty 50 around 20,370-odd levels in the present structure.
On the longer-term scale, the Nifty seems headed towards the higher-end of the Bollinger Bands on the monthly chart, which suggests that the index may face some resistance around 20,725 levels.
Breakout above the same, could trigger a rally towards the trend line resistance on the monthly scale, which hints of target around 22,500 levels for now.
CLICK HERE FOR THE CHART So although, the mood seems upbeat and the momentum clearly in favour of the bulls, the NSE benchmark may take its time to move from one major landmark to another in the form of 25,000-mark.
Having said that, an up move of another 9.5 per cent from today's level of 20,540 to 22,500 in the next few months seems possible, indicate charts.