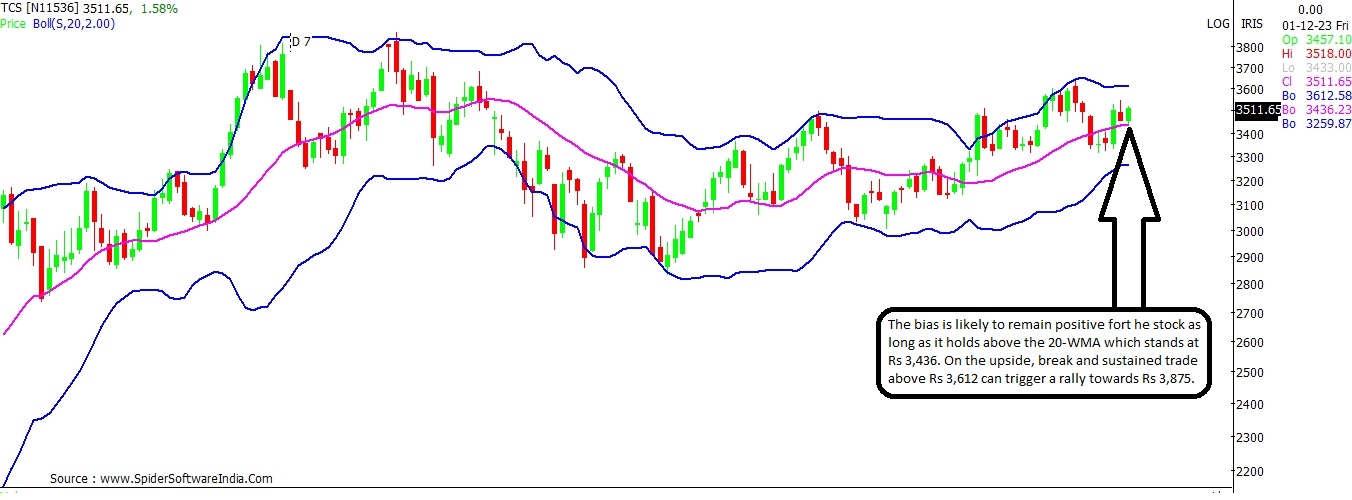
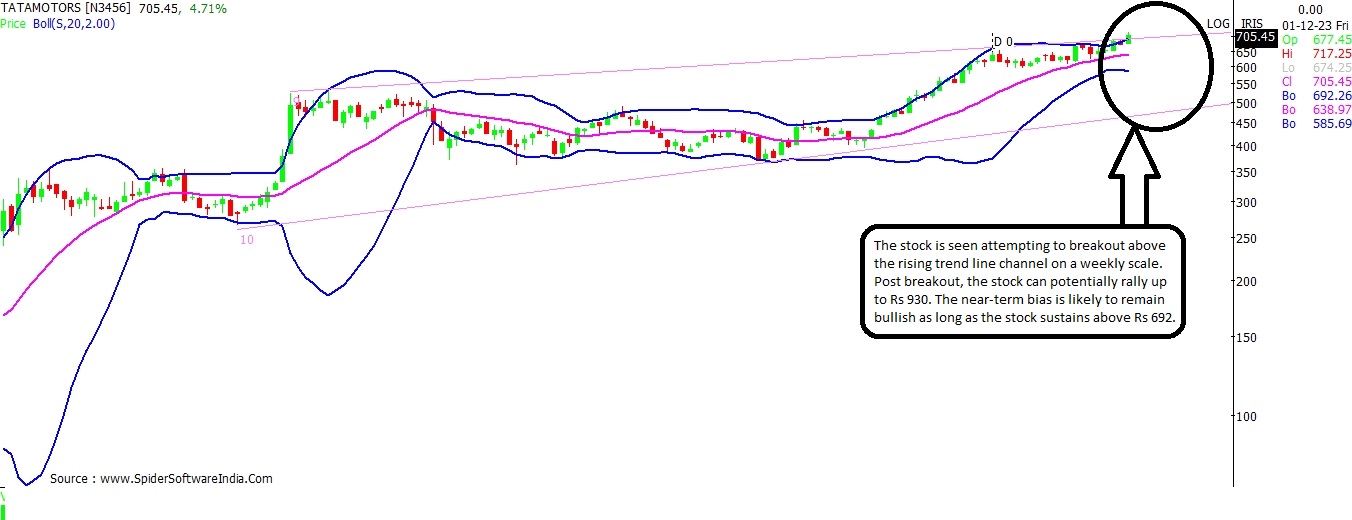
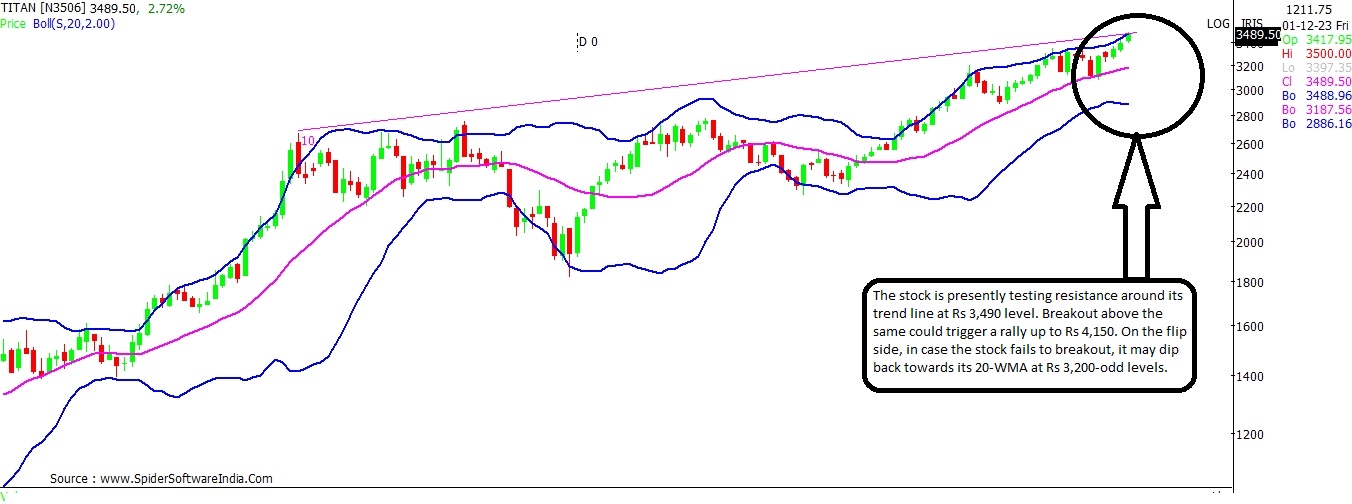
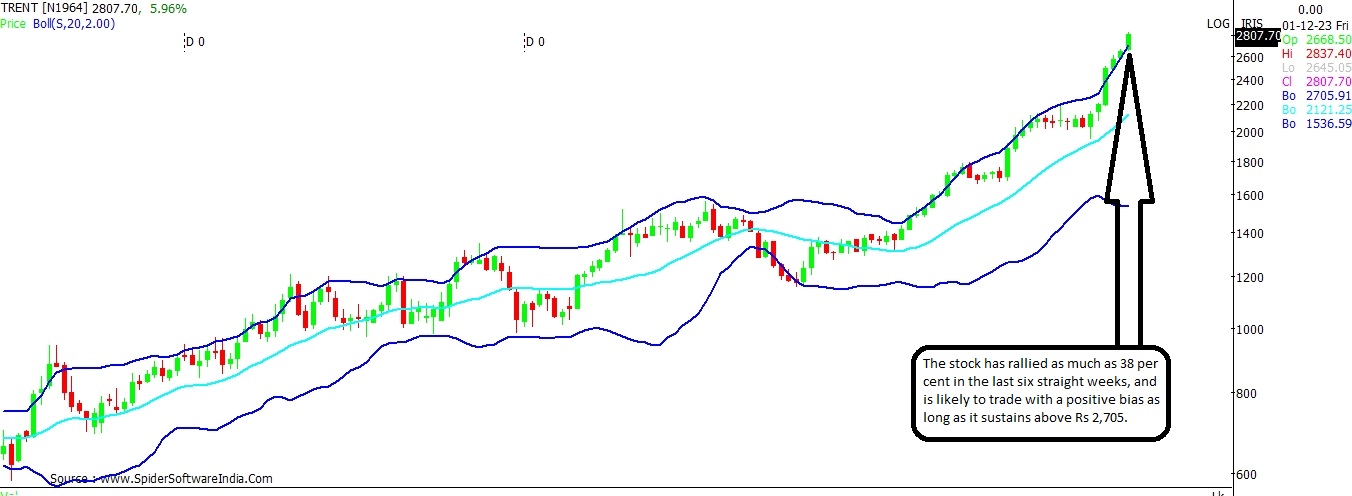
TCS, Tata Motors, Titan, IHCL: Track key levels for Tata Group stocks

Among the Tata Group stocks, shares of Tata Motors could potentially top the Rs 900-mark, while a select few could gain in the range of 15 - 19 per cent from present levels.

Tata Group
Tata Group
Rex Cano Mumbai
5 min read Last Updated : Dec 04 2023 | 9:50 AM IST
Shares of Tata Group have been in limelight of late, owing to its first-ever public share sale in almost two decades. The Group's Tata Technologies IPO not only received an overwhelming response, the stock also went on to debut on a stellar note, with the share price soaring as much as 180 per cent on listing day to Rs 1,400 as against the issue price of Rs 500 per share.

Given the keen investors interest at the Tata Technologies counter, and the ongoing share buyback programme of TCS (Tata Consultancy Services), the shares of Group companies are likely to remain in the limelight.

The IT major is in the process of buying back shares worth Rs 17,000 crore at Rs 4,150 apiece. The buyback closes on December 07.

Against this backdrop, here's what the charts suggest for Tata Group shares from a three-month perspective.

TCS
Last close: Rs 3,512
Upside Potential: 10.3%

TCS seems to be placed favourable on the weekly chart, with select momentum oscillators on the verge of turning positive on the monthly scale as well. The weekly chart suggests that the trend is likely to remain positive as long as the stock holds above its 20-WMA (Weekly Moving Average) at Rs 3,436.

However, on the upside, the stock has a near strong resistance zone in the Rs 3,550 - Rs 3,612 range. As and when the stock clears this resistance area, it can potentially rally towards Rs 3,875. CLICK HERE FOR THE CHART

Tata Motors
Last close: Rs 705
Upside Potential: 32%

Tata Motors is attempting to breakout from its rising trend line channel on the weekly scale. The potential breakout can trigger a sharp rally towards Rs 930-level, indicating an upside potential of 32 per cent.

In the very near term, the bias is likely to remain bullish as long as the stock can sustain above Rs 692. In case, the stock fails to hold this support, it can trigger some profit-taking with support seen around Rs 640 levels. CLICK HERE FOR THE CHART

Titan
Last close: Rs 3,490
Upside Potential: 19%

Titan is presently testing its trend line resistance at Rs 3,490-odd levels. Key momentum oscillators are in favour of the bulls, hence the stock is likely to break and sustain above the resistance.

On the upside, the stock can potentially gain around 19 per cent and test Rs 4,150 level. On the flip side, failure to clear the hurdle could see the stock dip back towards its 20-WMA at Rs 3,200-odd levels. CLICK HERE FOR THE CHART

Trent
Last close: Rs 2,808
Upside Potential: 12%

Trent has been logged steady gains for the last six straight weeks, and presently trades above the Bollinger Bands on both the weekly and monthly scale. As per these charts, the bias for the stock is likely to remain bullish as long as the stock sustains above Rs 2,705 and Rs 2,617, respectively.

The stock has rallied nearly 38 per cent in the last six weeks, and may look to add another 12 per cent, thus indicating an upside target of Rs 3,150. CLICK HERE FOR THE CHART

Tata Steel
Last close: Rs 130
Bias: Fresh gains on break above Rs 134 likely

Tata Steel has been consistently facing resistance around the higher-end of the Bollinger Bands on the weekly and monthly scale, indicating presence of stiff resistance around Rs 133 - Rs 134.

Following the recent rally, the stock has come within striking distance of this resistance zone. Fresh up move at the counter can be expected only after the stock successfully conquers this hurdle. On the downside, the stock is expected to find considerable support around Rs 123 levels. CLICK HERE FOR THE CHART

Tata Power
Last close: Rs 276
Upside Potential: 7%

Tata Power is trading fairly close to its trend line resistance on the weekly scale, which suggests potential hurdle at Rs 287-odd levels. However, key momentum oscillators both on the weekly and monthly scale are in favour of the bulls. 

Further, the monthly chart suggests that the stock is likely to trade with a positive bias as long as it holds above Rs 272. Hence, the stock may attempt to clear the near hurdle, and rally all the way towards its peak at Rs 295 - indicating an upside potential of 7 per cent. CLICK HERE FOR THE CHART

Tata Chemicals
Last close: Rs 970
Downside Risk: 15.5%

Tata Chemicals looks weak on the chart, as the stock not only trades below the short-term moving averages on the weekly scale, but also below the trend line support. 

The overall bias for the stock is expected to remain negative as long as the stock trades below Rs 1,010 level. On the downside, the stock has near support at Rs 930. Break and sustained trade below the same can trigger a massive fall towards Rs 820-odd levels. CLICK HERE FOR THE CHART

Indian Hotels
Last close: 426
Upside Potential: 8.5%

Indian Hotels has been witnessing a steady climb on a monthly scale since May 2021. The stock has rallied a solid 305 per cent in the last 31 months. In the present scenario, although key momentum oscillators are in overbought zone, the stock may stretch the up move towards Rs 462 - thus indicating an upside potential of 8.5 per cent from present levels.

Further, the weekly chart suggests that sustain trade above Rs 437-level could keep the mood buoyant at the counter. CLICK HERE FOR THE CHART

One subscription. Two world-class reads.

Already subscribed? Log in

Subscribe to read the full story →
*Subscribe to Business Standard digital and get complimentary access to The New York Times

Smart Quarterly

₹900

3 Months

₹300/Month

SAVE 25%

Smart Essential

₹2,700

1 Year

₹225/Month

SAVE 46%
*Complimentary New York Times access for the 2nd year will be given after 12 months

Super Saver

₹3,900

2 Years

₹162/Month

Subscribe

Renews automatically, cancel anytime

Here’s what’s included in our digital subscription plans

Exclusive premium stories online

  • Over 30 premium stories daily, handpicked by our editors

Complimentary Access to The New York Times

  • News, Games, Cooking, Audio, Wirecutter & The Athletic

Business Standard Epaper

  • Digital replica of our daily newspaper — with options to read, save, and share

Curated Newsletters

  • Insights on markets, finance, politics, tech, and more delivered to your inbox

Market Analysis & Investment Insights

  • In-depth market analysis & insights with access to The Smart Investor

Archives

  • Repository of articles and publications dating back to 1997

Ad-free Reading

  • Uninterrupted reading experience with no advertisements

Seamless Access Across All Devices

  • Access Business Standard across devices — mobile, tablet, or PC, via web or app

Topics :Market OutlookTata groupTata MotorsTCS stockTitan CompanyTrent LtdIndian HotelsTata PowerTata SteelTata Chemicals

Next Story