Brent oil prices rose on Wednesday to the highest since February after Saudi Arabia agreed to make bigger cuts in output than expected during a meeting with allied producers, while industry data showed US crude stockpiles fell last week, a Reuters report said. Brent crude surged up to $53.94 a barrel early today, the highest since Feb 26, 2020, extending its 5 per cent winning streak logged on Tuesday.
READ MORE In this backdrop, what should your trading strategy be for oil-linked stocks?
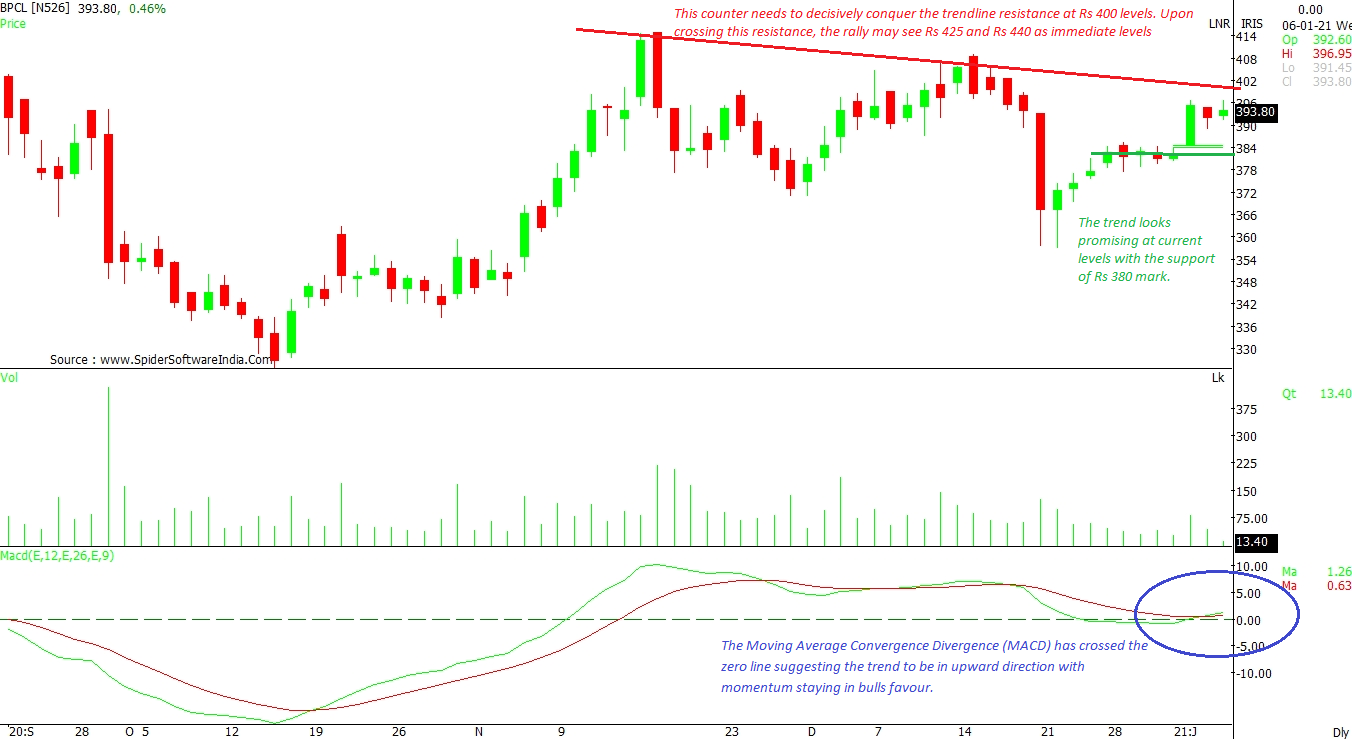
Bharat Petroleum Corporation Ltd (BPCL): The state-owned oil marketing company needs to decisively conquer the trendline resistance of Rs 400 levels to scale up to Rs 425 and Rs 440 levels, as per the daily chart. The trend looks promising at current levels with the support of Rs 380-mark. The Moving Average Convergence Divergence (MACD) has crossed the zero line, suggesting that the trend in the stock remains positive with momentum staying in the favour of the bulls.
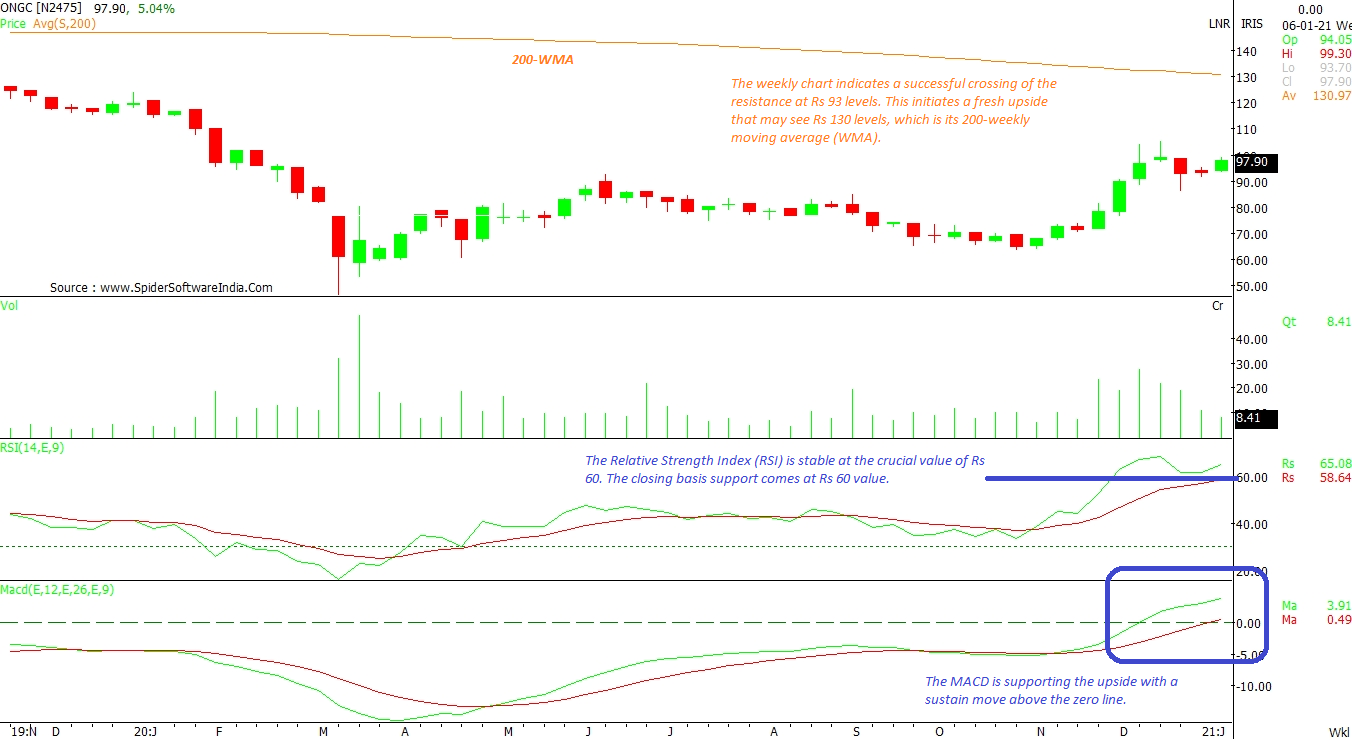
CLICK HERE FOR THE CHART Oil & Natural Gas Corporation Ltd (ONGC): The weekly chart indicates a successful crossing of the resistance placed at Rs 93 levels. The consequent upside may lift the stock price to Rs 130 levels, which is its 200-weekly moving average (WMA). The MACD indicator is supporting the upside with a sustain move above the zero line. Moreover, the Relative Strength Index (RSI) is stable at the crucial value of Rs 60. The closing basis support comes at Rs 60 value.
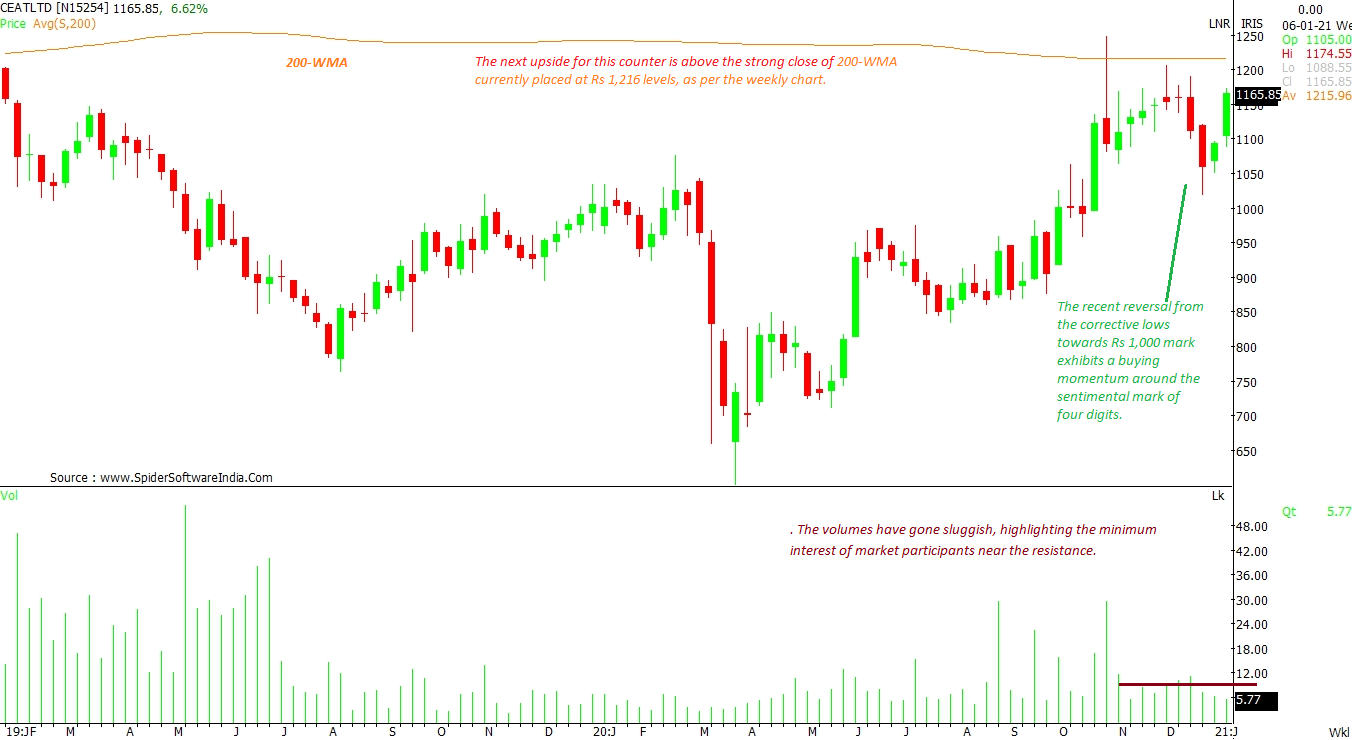
CLICK HERE FOR THE CHART CEAT Limited (CEATLTD): This tyre stock needs to close above Rs 1,216 levels, which is its 200-WMA, to see next leg of rally, weekly charts suggest. The recent reversal from the lows of Rs 1,000-mark exhibits a buying sentiment around the crucial mark of four digits. However, volumes in the stock have become thin in the recent past, highlighting low interest of market participants near the resistance.
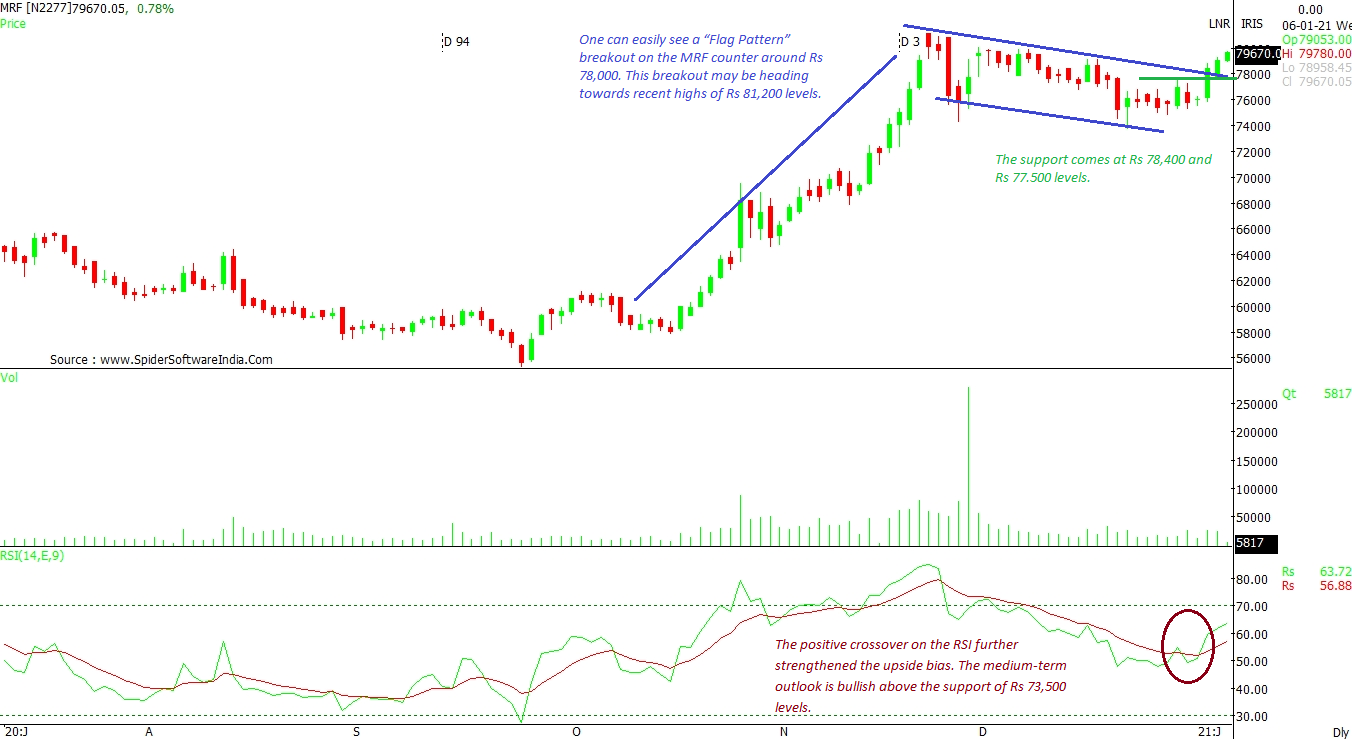
CLICK HERE FOR THE CHART MRF Limited (MRF): One can easily see a "Flag Pattern" breakout on the MRF stock around Rs 78,000. This breakout may be heading towards recent highs of Rs 81,200 levels. The support comes at Rs 78,400 and Rs 77,500 levels. That apart, positive crossover on the RSI further strengthens the upside bias. The medium-term outlook is bullish if the stock holds the support of Rs 73,500 levels.
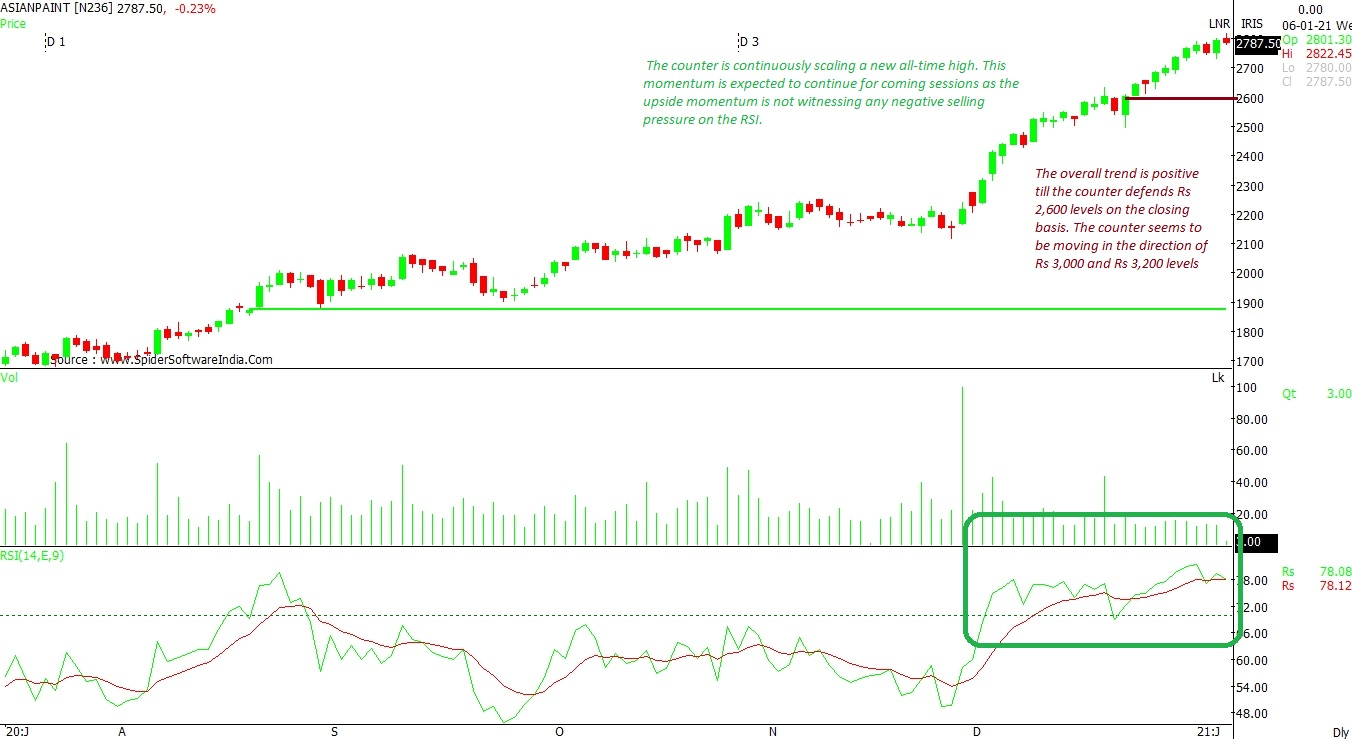
CLICK HERE FOR THE CHART Asian Paints Ltd (ASIANPAINT): The stock is consistently scaling new all-time highs day after day. This momentum is expected to continue in the coming sessions as the upside momentum is not witnessing any negative selling pressure on the RSI. The overall trend is positive as long as the counter defends Rs 2,600 levels on the closing basis. The counter seems to be moving in the direction of Rs 3,000 and Rs 3,200 levels, as per daily chart.
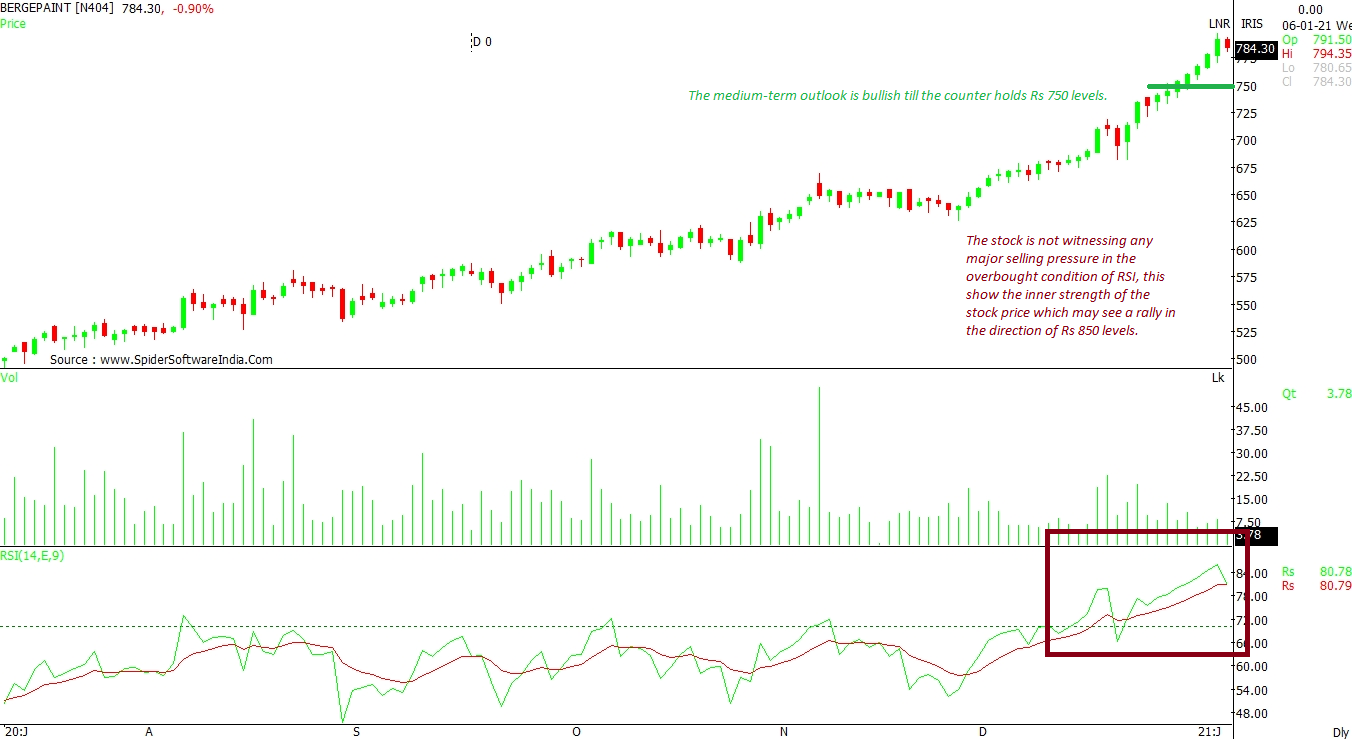
CLICK HERE FOR THE CHART Berger Paints India (BERGEPAINT): The medium-term outlook is bullish till the counter holds Rs 750 levels on closing basis. Despite being in the overbought zone on the RSI indicator, the stock is not witnessing any major selling pressure which shows the stock's inner strength. This positive sentiment may push the stock price towards Rs 850 levels. The counter has a closing basis support of Rs 750 levels.
CLICK HERE FOR THE CHART  "ONGC, Asian Paints: Bull sentiment intact in oil-linked stocks, charts show")


