That said, let's take a look at what technical charts indicate for fertiliser stocks and how you should trade them.
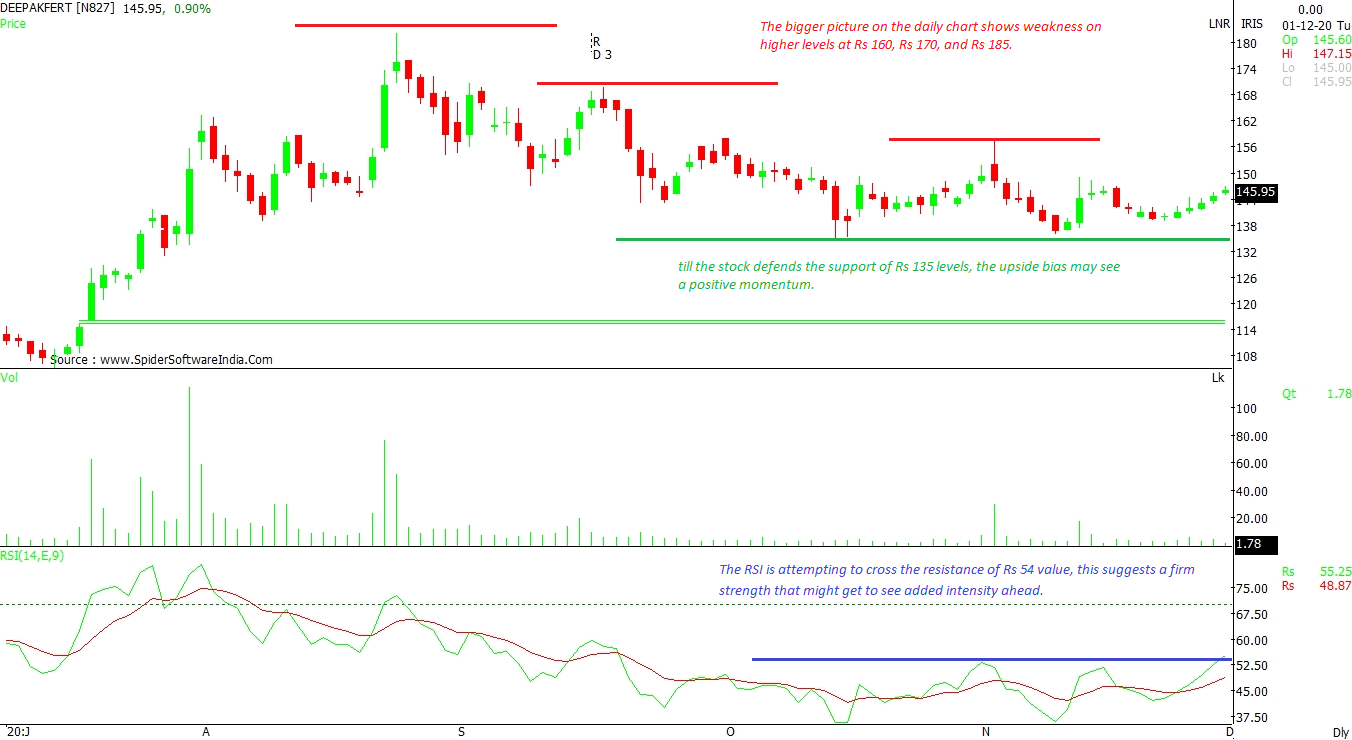
Deepak Fertilisers & Petrochemicals Corp. Ltd (DEEPAKFERT): The bigger picture on the daily chart shows weakness on higher levels at Rs 160, Rs 170, and Rs 185. That said, till the stock defends the support of Rs 135 levels, the upside bias may see a positive momentum. The Relative Strength Index (RSI) is attempting to cross the resistance of Rs 54 value. This suggests strength which may increase going ahead.
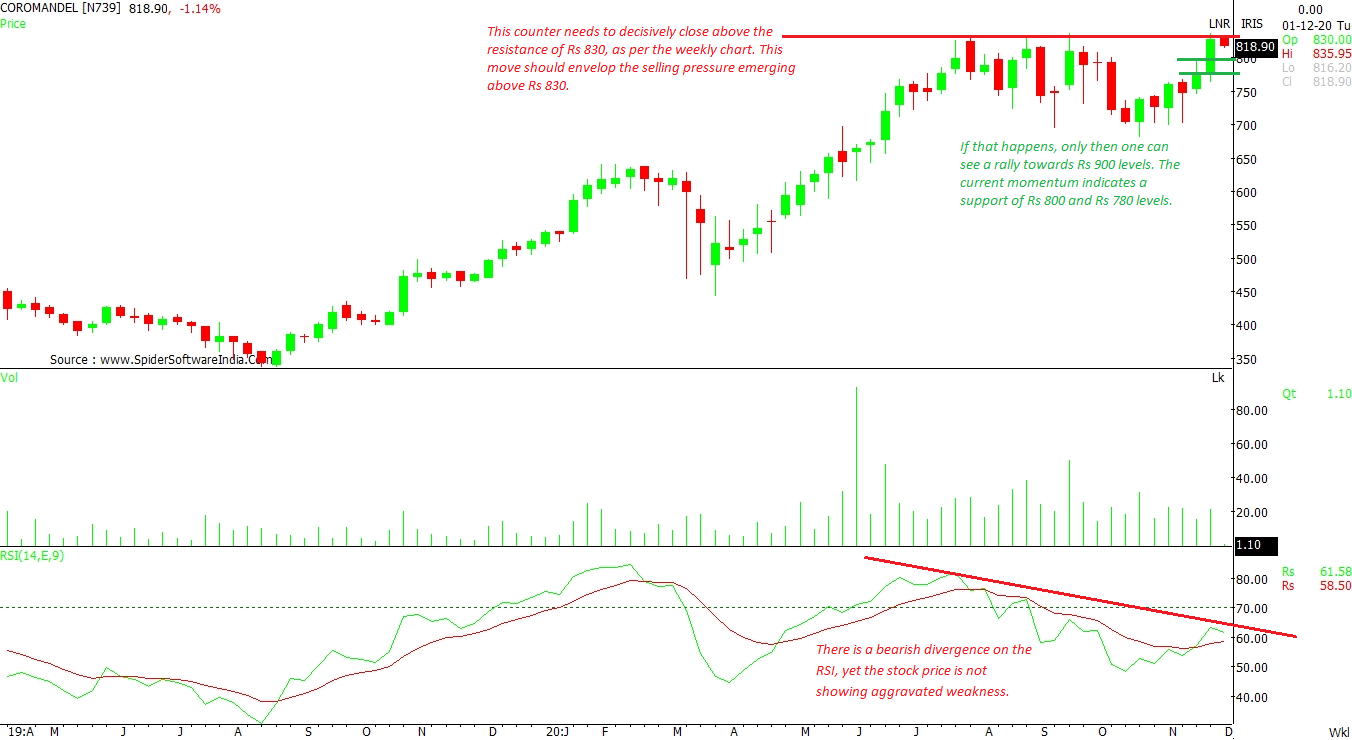
CLICK HERE FOR THE CHART Coromandel International Limited (COROMAMDEL): This counter needs to decisively close above the resistance of Rs 830, as per the weekly chart. This move should breach the selling pressure emerging above Rs 830. If that happens, only then one can see a rally towards Rs 900 levels. The current momentum indicates a support of Rs 800 and Rs 780 levels. There is a bearish divergence on the RSI, yet the stock price is not showing much weakness.
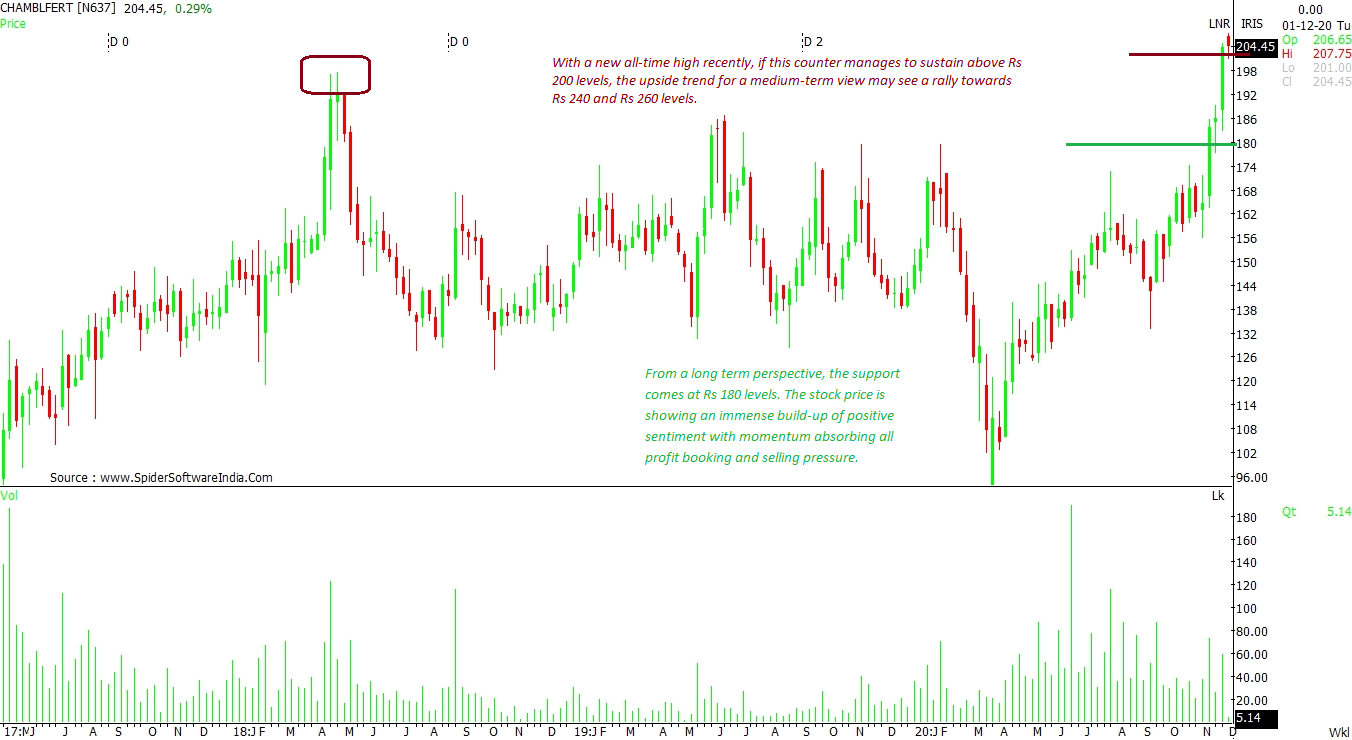
CLICK HERE FOR THE CHART Chambal Fertilizers & Chemicals Ltd (CHAMBLFERT): The counter recently scaled a new all-time high. If it manages to sustain above Rs 200 levels, the upside trend for a medium-term view may see a rally towards Rs 240 and Rs 260 levels. From a long term perspective, the support comes in at Rs 180 levels. The stock price is showing an immense build-up of positive sentiment with momentum absorbing all profit booking and selling pressure.
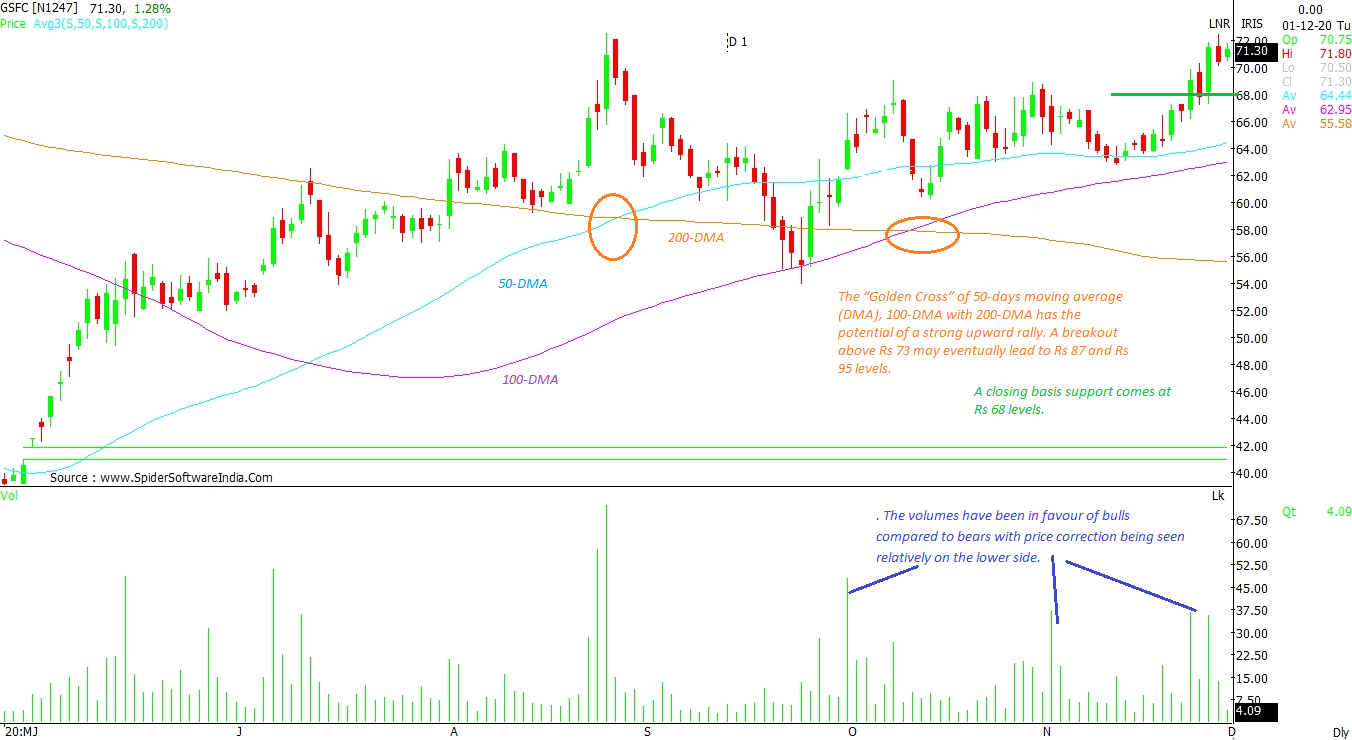
CLICK HERE FOR THE CHART Gujarat State Fertilizers & Chemicals Limited (GSFC): The “Golden Cross” formation of 50-day moving average (DMA), 100-DMA with 200-DMA has the potential of a strong upward rally. A breakout above Rs 73 may eventually lead to Rs 87 and Rs 95 levels. A closing basis support comes in at Rs 68 levels. The volumes have been in favour of bulls compared to bears with price correction being seen relatively on the lower side.
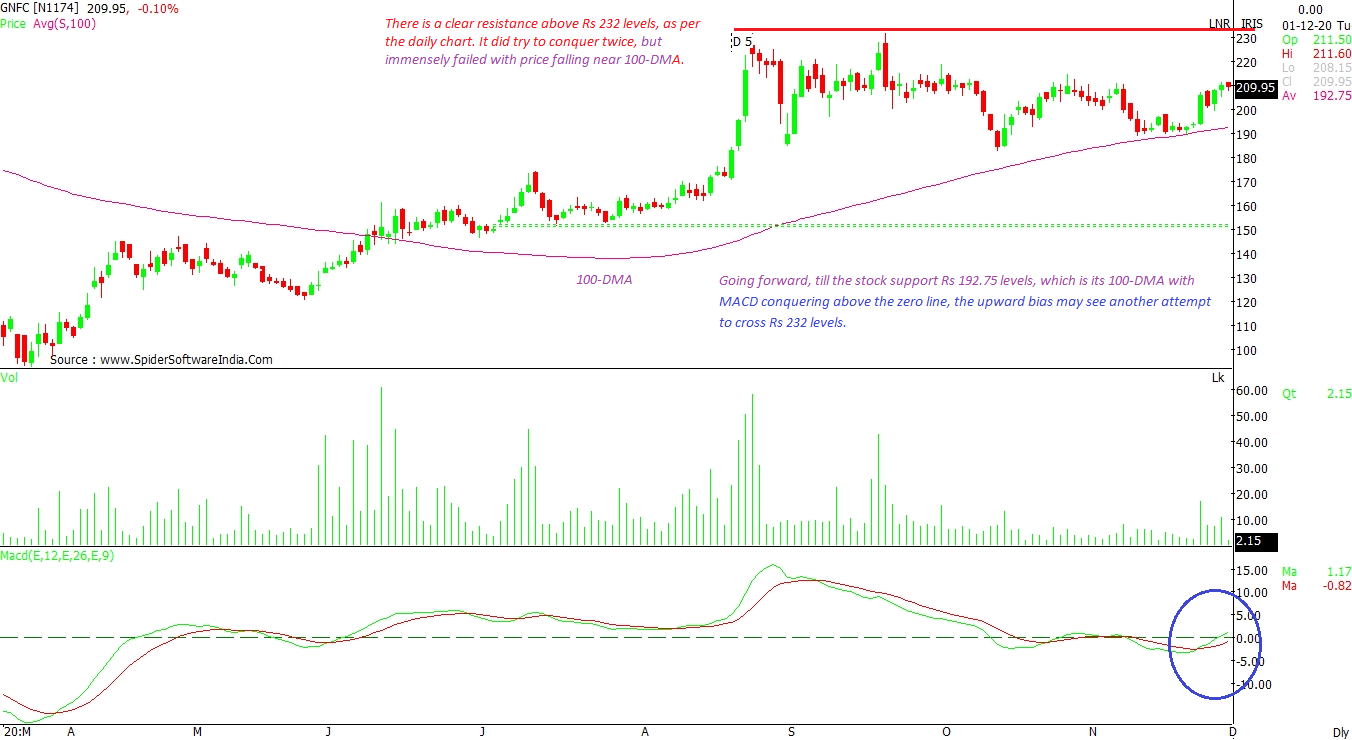
CLICK HERE FOR THE CHART Gujarat Narmada Valley Fertilizers and Chemicals Ltd (GNFC): There is a clear resistance above Rs 232 levels, as per the daily chart. It did try to conquer it twice, but failed with price falling near 100-DMA. Going forward, till the stock finds support at Rs 192.75 levels, which is its 100-DMA, with MACD conquering above the zero line, the upward bias may see another attempt to cross Rs 232 levels.
CLICK HERE FOR THE CHART  "Deepak Fertilisers, GSFC, GNFC: What charts indicate for fertiliser stocks")


