Shares of non-banking financial companies (NBFCs) were trading mixed on Thursday, a day after
Finance Minister Nirmala Sitharaman announced a major liquidity boost of Rs 75,000 crore to NBFCs and microfinance institutions (MFIs).
While these announcements are enough to keep NBFCs, and micro finance institutions (MFIs) afloat in the current environment where working capital is drying up, it
won’t revive the sector per se, says Siddharth Purohit, equity research analyst at SMC Global Securities.
Below is an analysis of key NBFC stocks on technical parameters. Take a look.
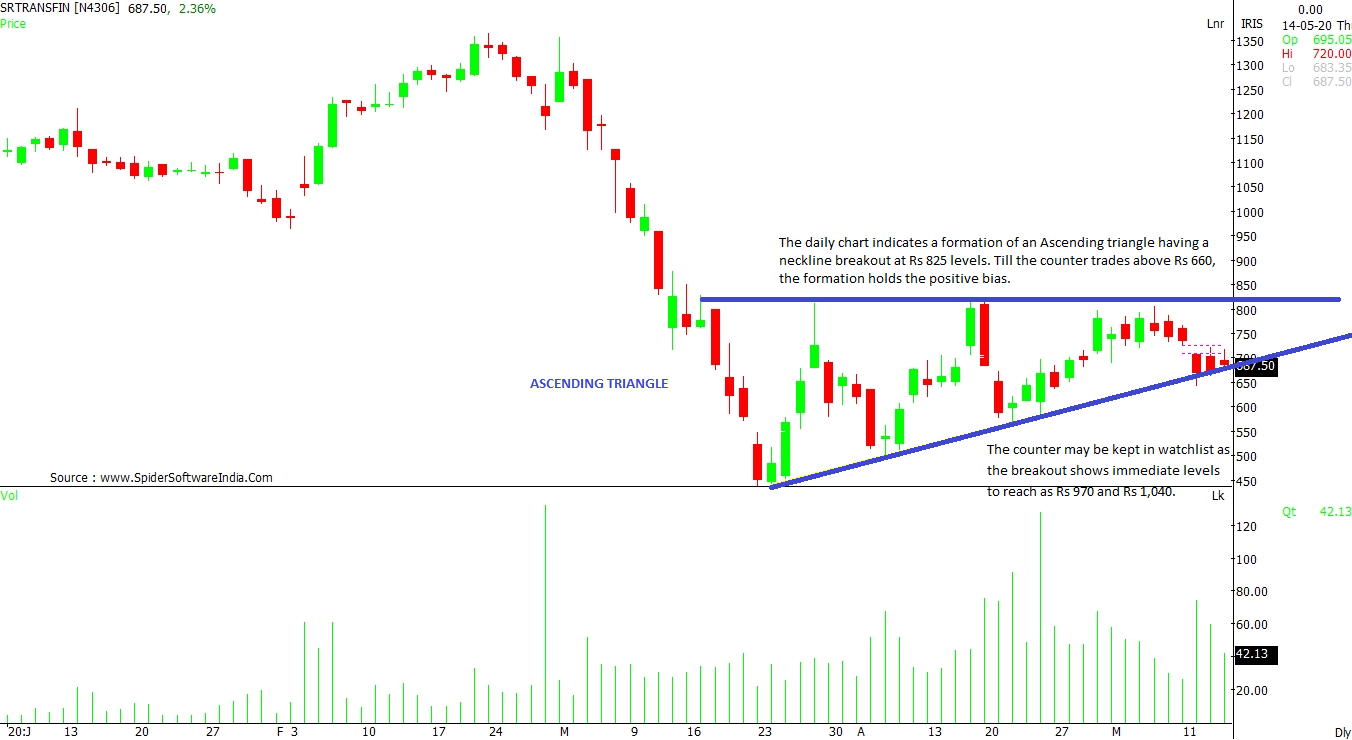
Shriram Transport Finance Co. Ltd (SRTRANSFIN): The daily chart indicates a formation of an "Ascending triangle", having a neckline breakout at Rs 825 levels. Till the counter trades above Rs 660, the formation holds the positive bias. The current momentum suggests indecision with a hanging man candlestick. The counter may be kept in watchlist as the breakout shows immediate levels to reach as Rs 970 and Rs 1,040.
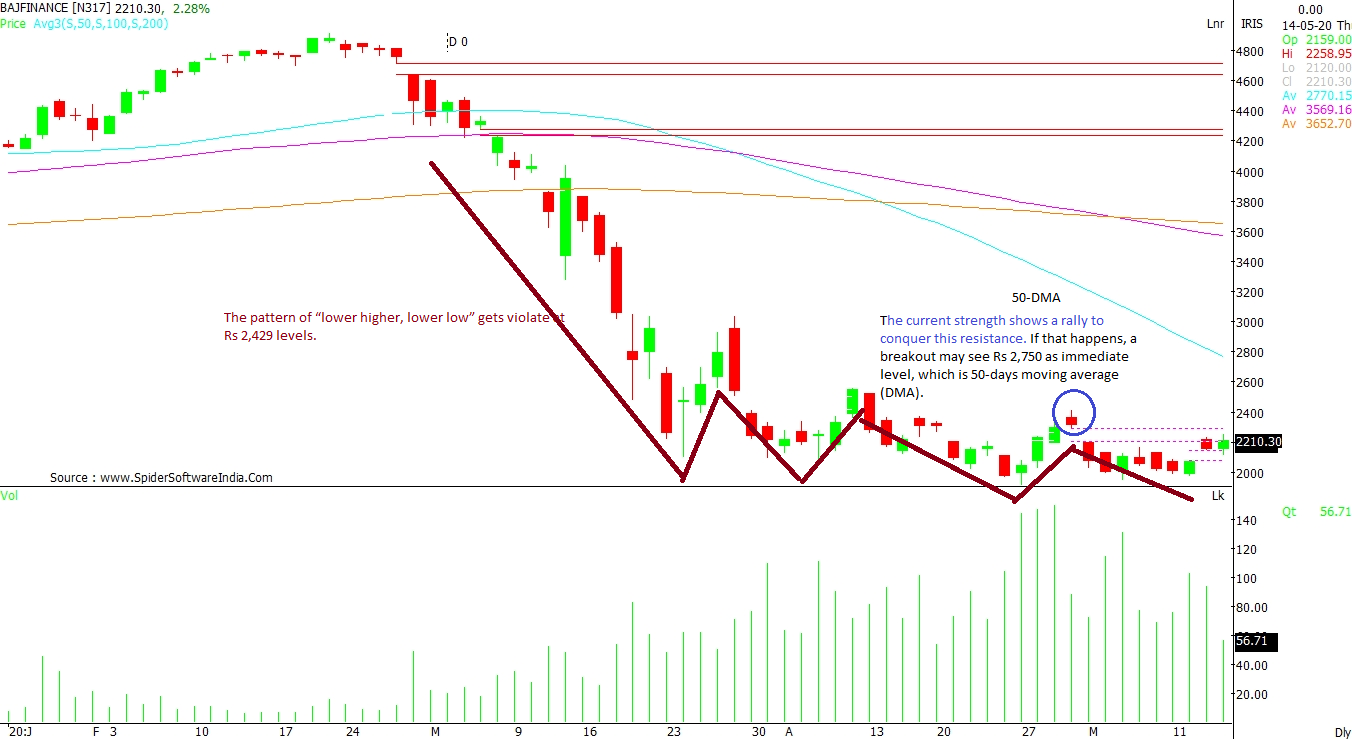
CLICK HERE FOR THE CHART Bajaj Finance Ltd (BAJFINANCE): The pattern of “lower higher, lower low” gets violated at Rs 2,429 levels. The current strength shows a rally to conquer this resistance. If that happens, a breakout may see Rs 2,750 as immediate level, which is its 50-day moving average (DMA). The trend stays with a positive bias having a support of Rs 1,950 levels.
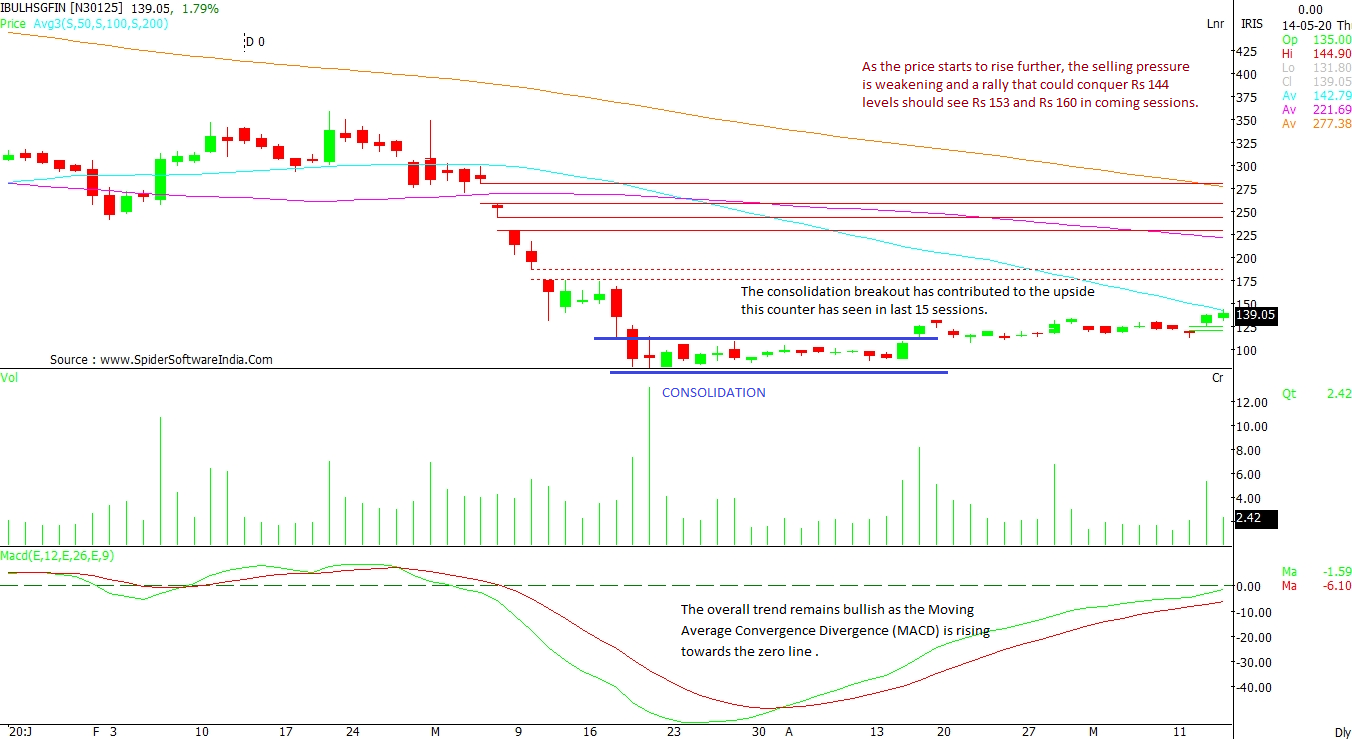
CLICK HERE FOR THE CHART Indiabulls Housing Finance Ltd (IBULHSGFIN): The consolidation breakout has contributed to the upside this counter has seen in last 15 sessions. As the price starts to rise further, the selling pressure is expected to weaken and a rally that could conquer Rs 144 levels should see Rs 153 and Rs 160 in the coming sessions. The overall trend remains bullish as the Moving Average Convergence Divergence (MACD) is rising towards the zero line.
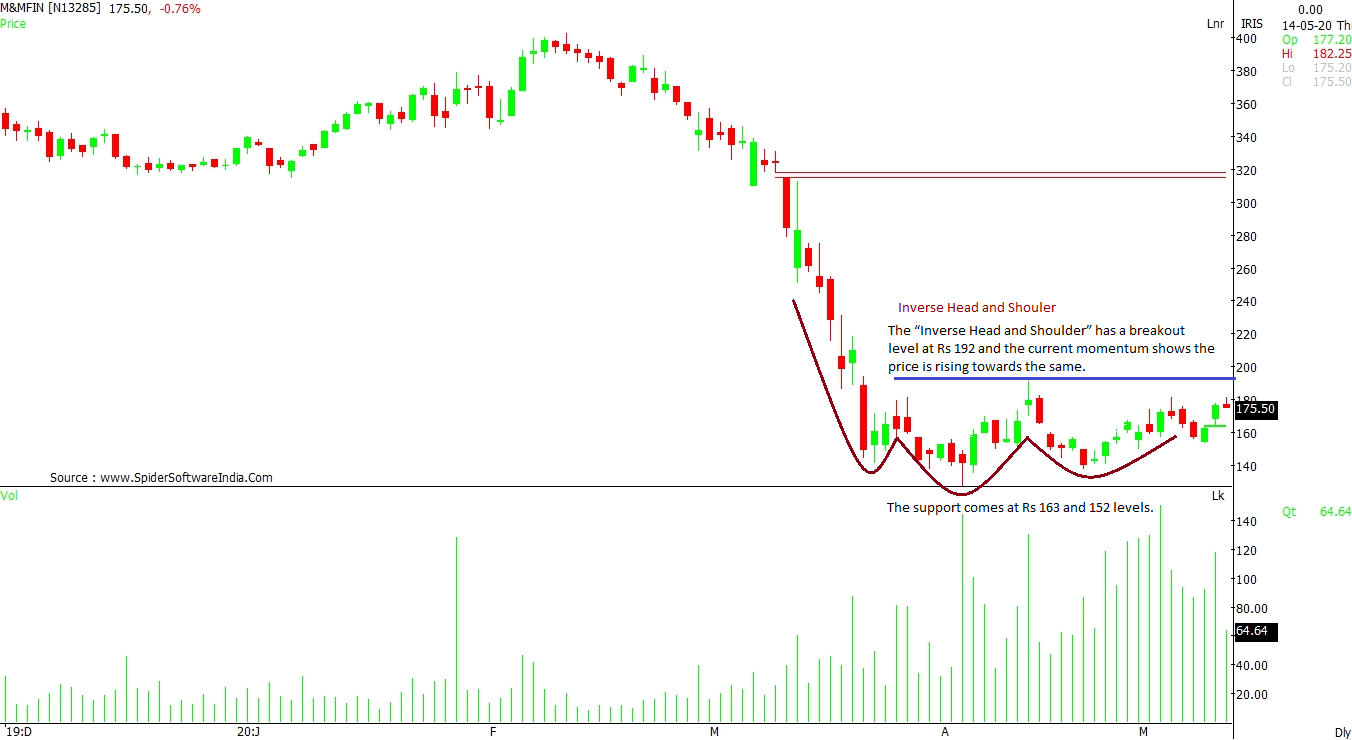
CLICK HERE FOR THE CHART Mahindra & Mahindra Financial Services Ltd (M&MFIN): The “Inverse Head and Shoulder” has a breakout level at Rs 192 and the current momentum shows the price is rising towards the same. As it does that with a gap up close, the volume seems to rise in the near future providing a stability and reduced volatility. The support comes in at Rs 163 and 152 levels.
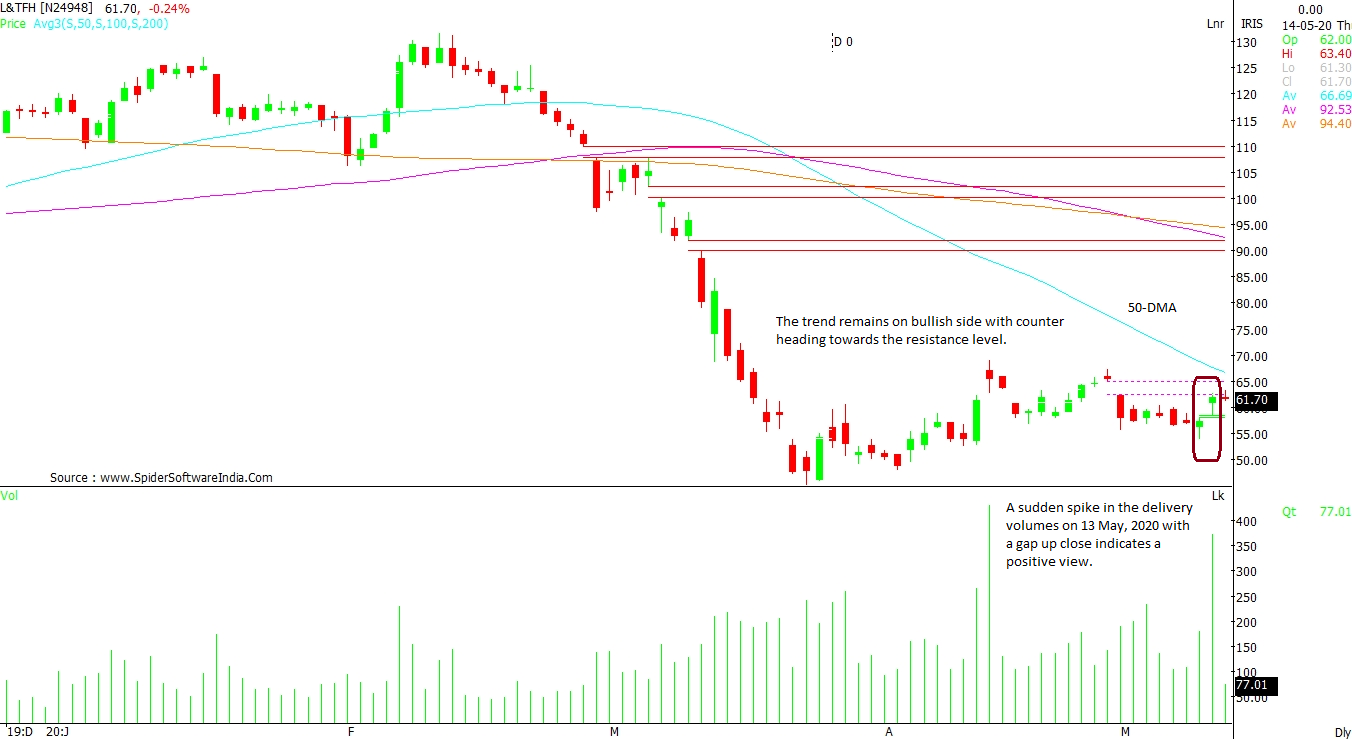
CLICK HERE FOR THE CHART L&T Finance Holdings Ltd (L&TFH): A sudden spike in the delivery volumes on May 13 with a gap-up close indicates a positive view. The immediate resistance is of 50-DMA placed at Rs 66.70 levels. The trend remains on the bullish side with counter heading towards the resistance level. The support remains at Rs 56 for an immediate trend and short term trend to have closing basis support at Rs 54 levels.
CLICK HERE FOR THE CHART  "Indiabulls Hsg, Bajaj Fin: 5 NBFCs that are heading towards breakout levels")


