Home / Markets / News / Tata Steel, Hindalco: Golden Cross breakout can trigger bull-run in metals
Tata Steel, Hindalco: Golden Cross breakout can trigger bull-run in metals
The Nifty Metal index seems to be eyeing a new historic peak at 6,900-level; Thus, select stocks from this space could rally up to 15 per cent on their respective breakouts.
4 min read Last Updated : Nov 30 2022 | 12:27 PM IST
The Nifty Metal index has rallied 18 per cent so far this calendar year, despite high amount of volatility during the first-half of the year. Thereafter, the index witnessed a sideways trend between August to early November, an approximate period of three months.
The metal index has now broken out of the sideways pattern on a bullish note. The index has witnessed a "Golden Cross” breakout, which implicates a likely bull-run ahead.
On Wednesday, Jindal Steel & Power surged close to 5 per cent. Hindustan Copper and Hindalco gained 3.50 per cent and 2.50 per cent, respectively. Similarly, Tata Steel, Vedanta and JSW Steel were up between 1.20 per cent - 1.50 per cent.
With technical charts suggesting a bullish view for metal stocks and its index for upcoming sessions, here’s an outlook to help you understand the likely future course:-
Nifty Metal Index
Likely target: 6,900
Upside potential: 6%
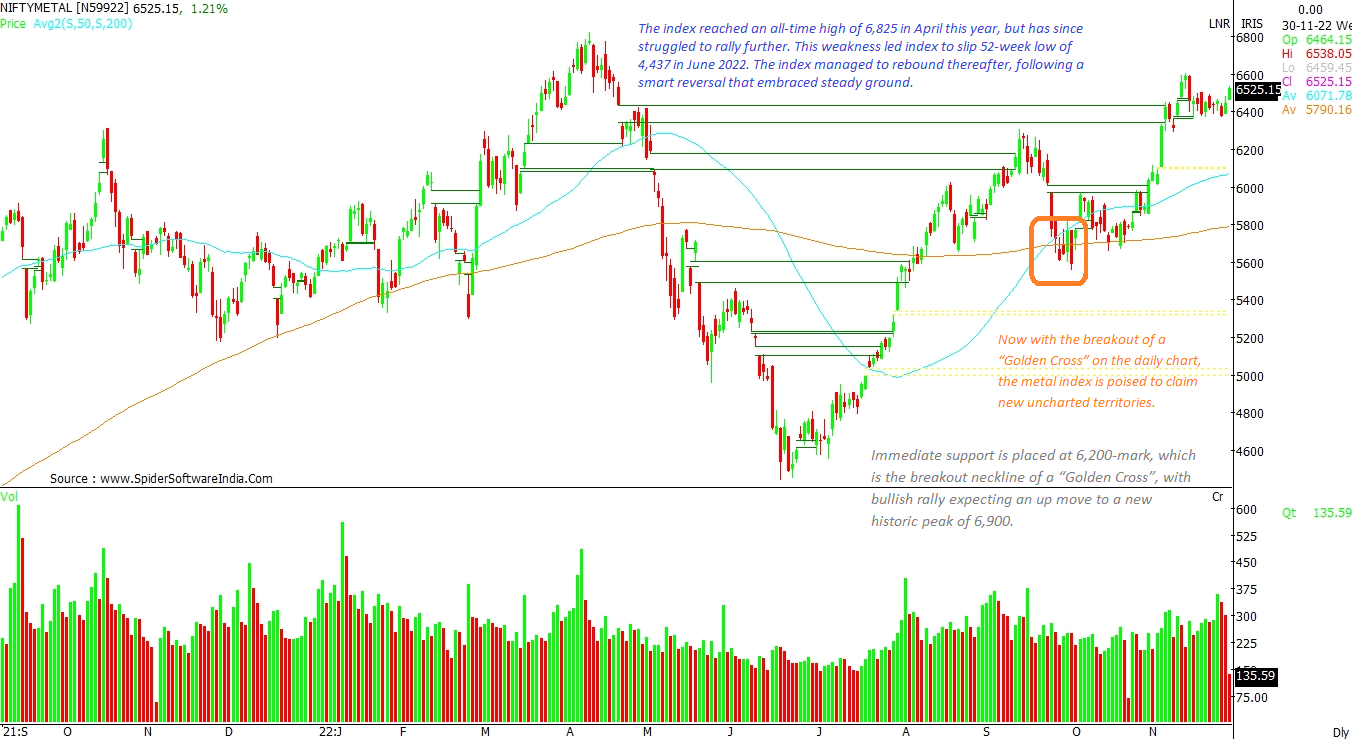
The index reached an all-time high of 6,825 in April this year, but since struggled to rally further. Significant weakness in metal shares led the index slip to its 52-week low at 4,437 in June 2022. The index managed to rebound thereafter, following a smart reversal. Now with the breakout of a “Golden Cross” on the daily chart, the metal index is poised to claim new uncharted territories.
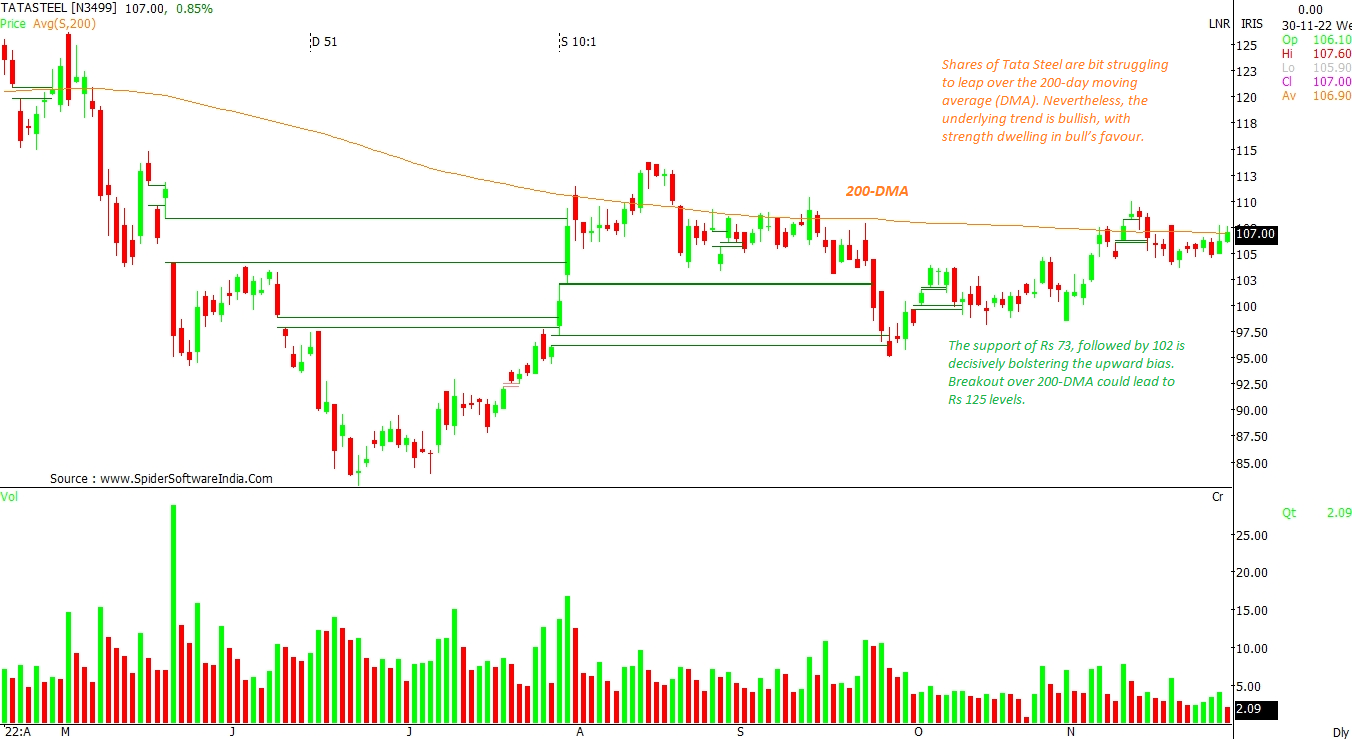
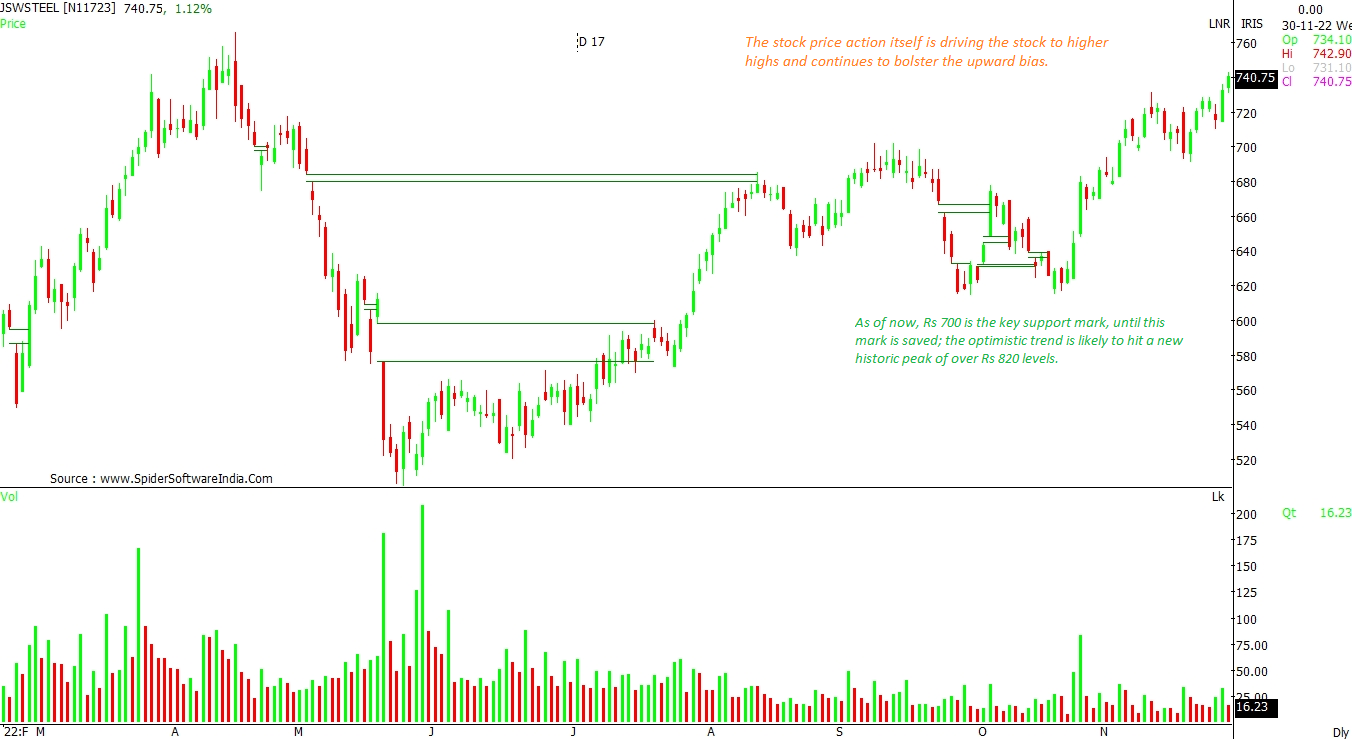
The immediate support for the index is placed at 6,200-mark, which is the breakout neckline of a “Golden Cross”, with bullish rally expecting an up move to a new historic peak of 6,900. CLICK HERE FOR THE CHART
Jindal Steel & Power (JINDALSTEL)
Likely target: Rs 600
Upside potential: 13%
Despite trading in the overbought category of the Relative Strength Index (RSI) in recent trading sessions, the stock fared well and seems to have resumed the upward trend. The breakout over the recent peak of Rs 532 triggers further push in upward momentum. With support at Rs 500, which needs to be honoured on a closing basis, the stock could easily ride to Rs 600 level. CLICK HERE FOR THE CHART
Tata Steel Ltd (TATASTEEL)
Outlook: Sustained over 200-DMA could see Rs 125
Shares of Tata Steel seem to be struggling to leap over the 200-day moving average (DMA). Nevertheless, the underlying trend is bullish, with strength dwelling in bull’s favour. The support of Rs 73, followed by Rs 102 is decisively bolstering the upward bias. Breakout above the 200-DMA could lead to Rs 125 level. CLICK HERE FOR THE CHART
JSW Steel Ltd (JSWSTEEL)
Likely target: Rs 820
Upside potential: 10%
The stock price action itself is driving the stock to higher highs and continues to bolster the upward bias. As of now, Rs 700 is the key support mark. As long as this mark is held, the optimistic trend is likely to hit a new historic peak of over Rs 820 level. CLICK HERE FOR THE CHART
Vedanta Ltd (VEDL)
Outlook: Breakout above Ascending triangle could spell up to 14% gains
Shares of Vedanta have formed an “ascending triangle” pattern, which once surpassed, could prompt bulls to ride an upside jump. The stock could then see Rs 340 and R 360, as an immediate reach. For now, the candlestick formations hints at a considerate texture, with a firm intent to rally higher. This mood could lead to a breakout and then an upward rally. Support for the stock is seen at Rs 284 level. CLICK HERE FOR THE CHART
Hindalco Industries Ltd (Hindalco)
Likely target: Rs 480 and Rs 500
Upside potential: 7% to 11%
The present formation on the daily chart of Hindalco Industries demonstrations the stock’s ability to rebound after retracing support levels near Rs 425-mark. The stock is in uptrend, with further longs to see addition above Rs 460 mark. The bullish outlook points to an upside to Rs 480 and Rs 500 levels. CLICK HERE FOR THE CHART