Below is a look at what technical charts indicate for Nifty IT and key IT stocks and how you should trade them ahead of Q2 earnings.
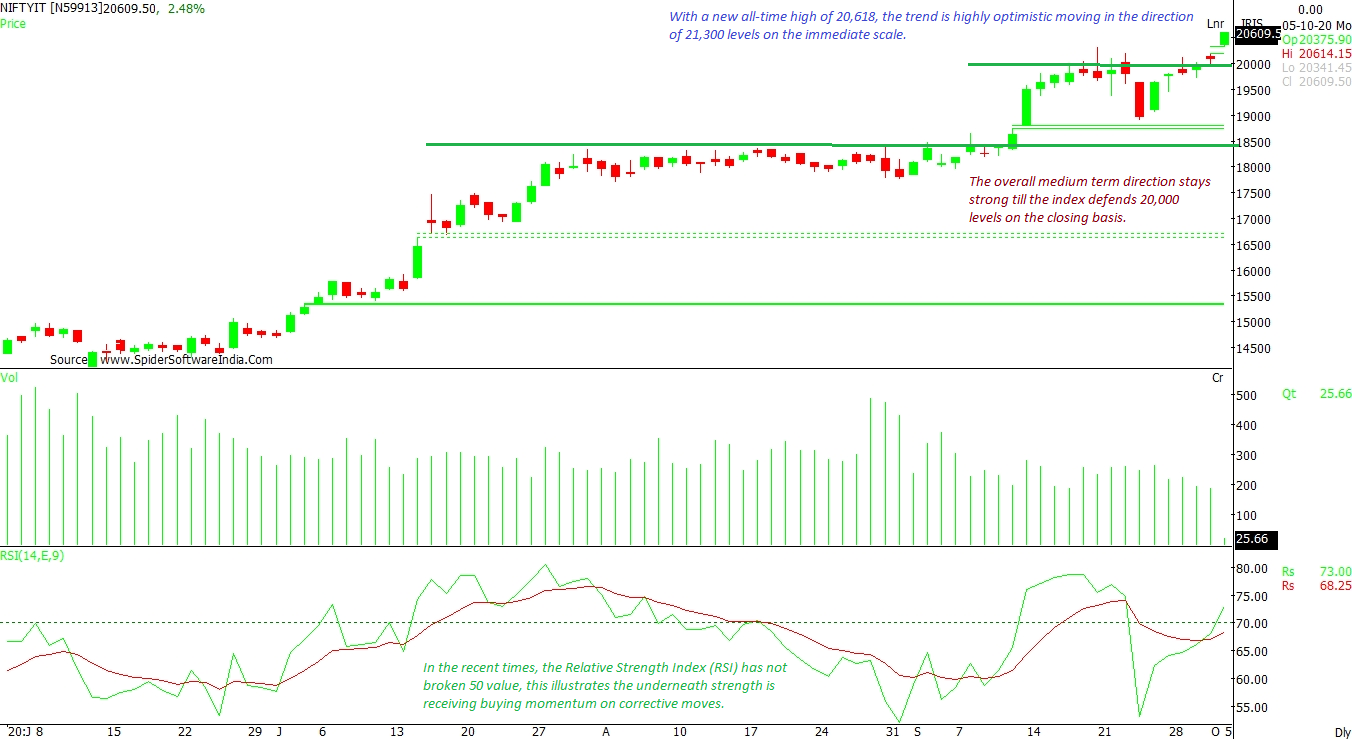
NIFTY IT INDEX: With a new all-time high of 20,618 levels, the trend on the index is highly optimistic and it is moving in the direction of 21,300 levels on the immediate scale. The overall medium term direction stays strong till the index defends 20,000 levels on the closing basis. In the recent times, the Relative Strength Index (RSI) has not broken 50 value. This indicates that the underneath strength is receiving buying momentum on corrective moves.
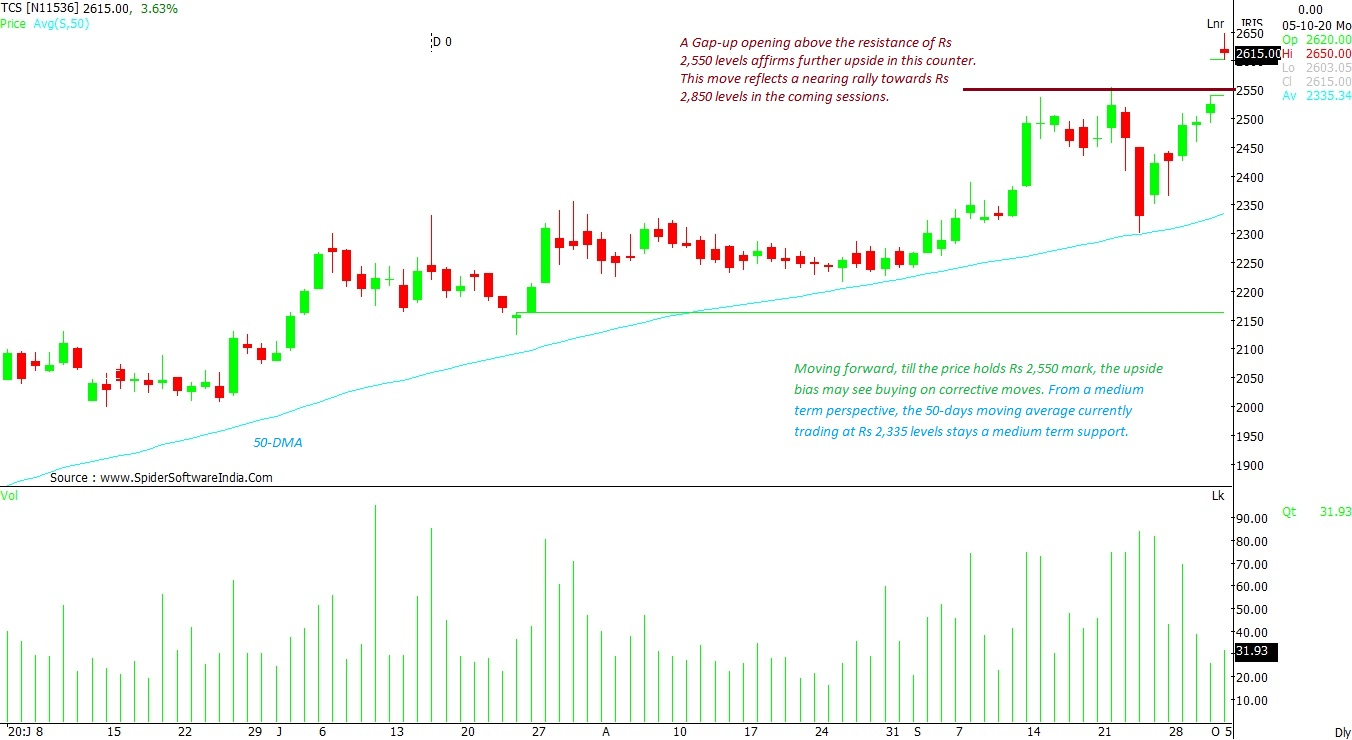
CLICK HERE FOR THE CHART Tata Consultancy Services Limited (TCS): A gap-up opening above the resistance of Rs 2,550 levels affirms further upside in this counter. This move reflects an immediate rally towards Rs 2,850 levels in the coming sessions. Moving forward, till the price holds Rs 2,550 mark, the upside bias may see buying on corrective moves. From a medium term perspective, the 50-day moving average (DMA) placed at Rs 2,335 levels, stays as a medium term support.
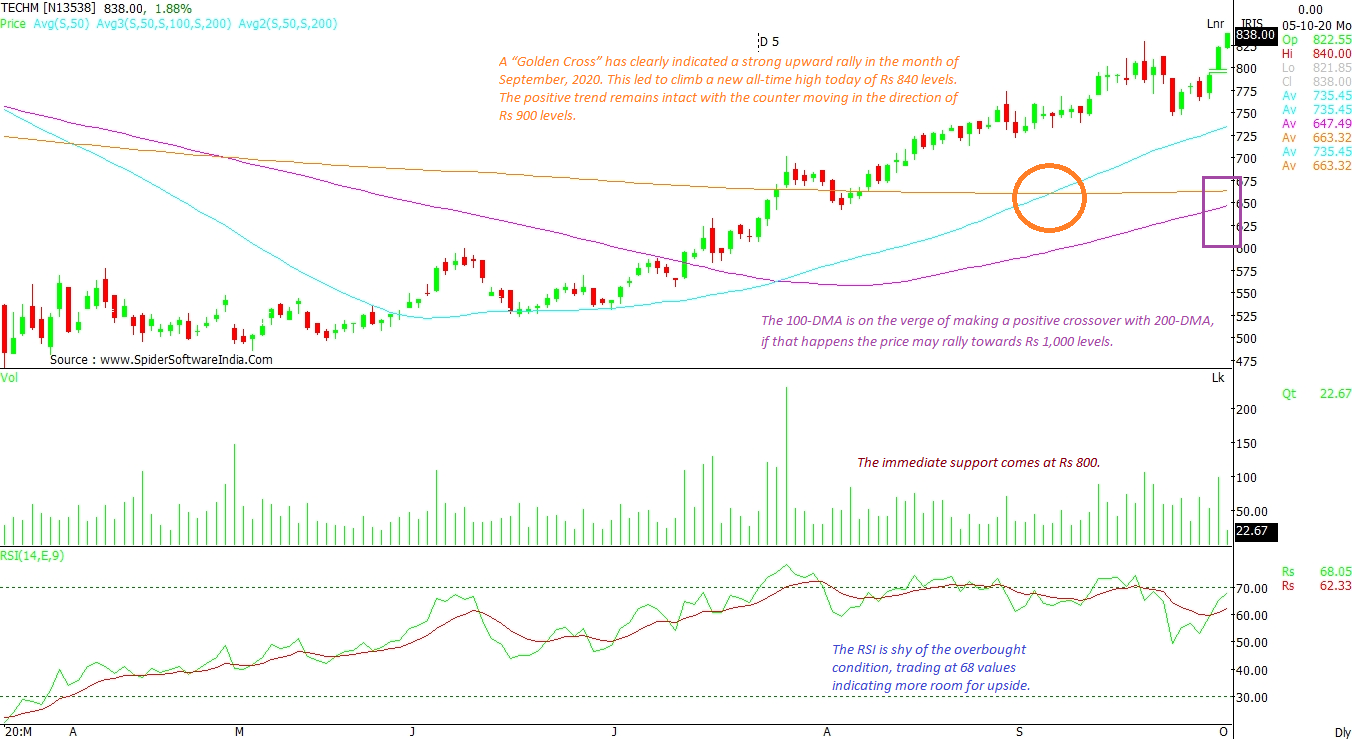
CLICK HERE FOR THE CHART Tech Mahindra Ltd (TECHM): A “Golden Cross” formation has clearly shown a strong upward rally in September 2020. This led to scale a new all-time high of Rs 840 levels today. The positive trend remains intact with the counter moving in the direction of Rs 900 levels. The immediate support comes in at Rs 800. The RSI is shy of the overbought condition, trading at 68 values indicating more room for upside. The 100-DMA is on the verge of making a positive crossover with 200-DMA. If that happens, the price may rally towards Rs 1,000 levels.
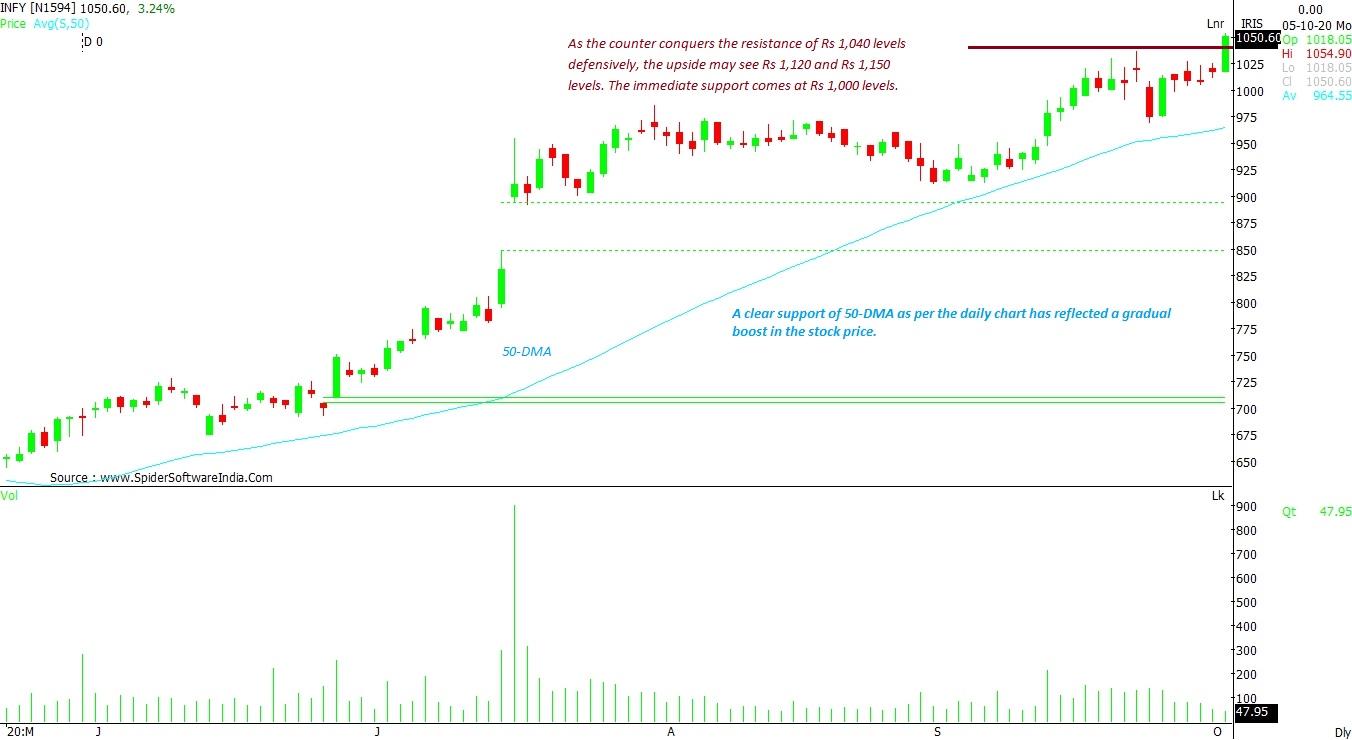
CLICK HERE FOR THE CHART Infosys Ltd (INFY): A clear support of 50-DMA, as per the daily chart, has reflected a gradual boost in the stock price. As the counter conquers the resistance of Rs 1,040 levels defensively, the upside may see Rs 1,120 and Rs 1,150 levels. The immediate support comes in at Rs 1,000 levels.
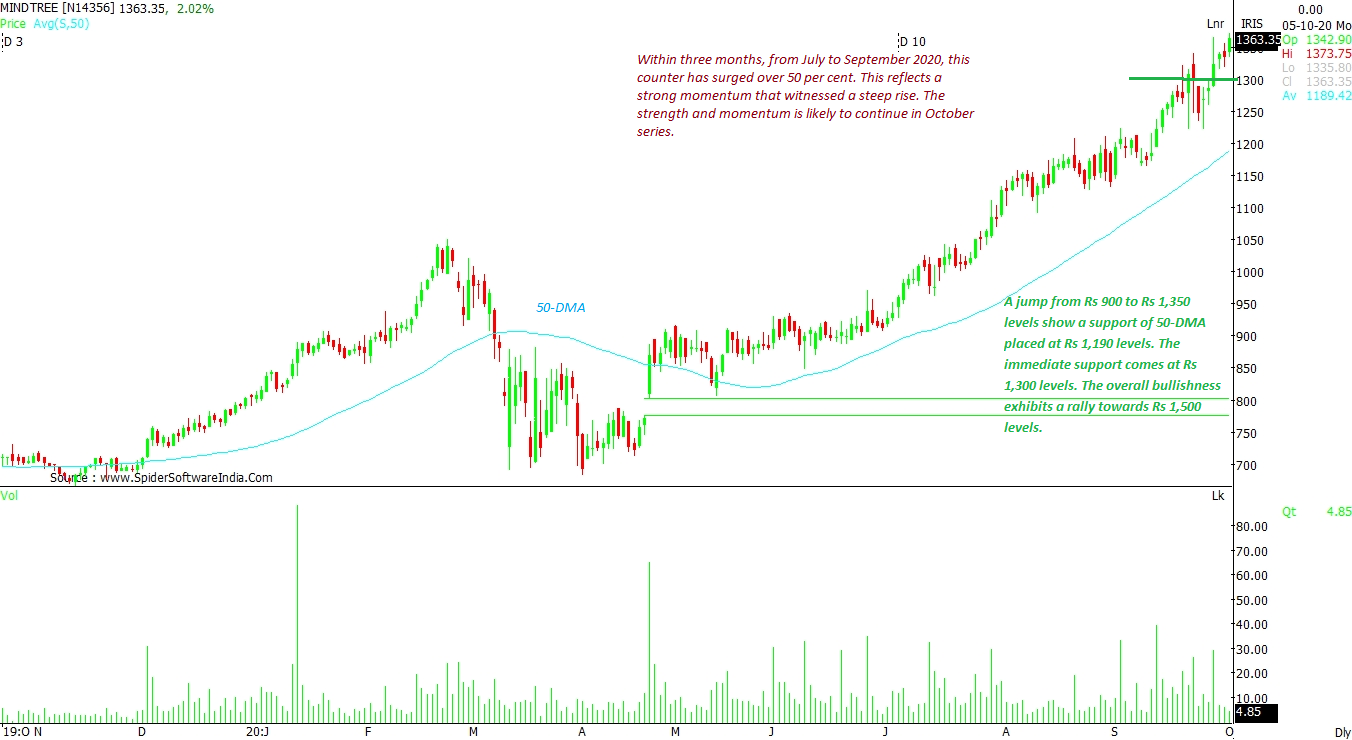
CLICK HERE FOR THE CHART MindTree Limited (MINDTREE): Within three months, from July to September 2020, this counter has surged over 50 per cent. This reflects a strong momentum that witnessed a steep rise. The momentum is likely to continue in October series. A jump from Rs 900 to Rs 1,350 levels shows a support of 50-DMA placed at Rs 1,190 levels. The immediate support comes in at Rs 1,300 levels. The overall bullishness exhibits a rally towards Rs 1,500 levels.
CLICK HERE FOR THE CHART  "TCS, Infosys, MindTree: How to trade IT stocks ahead of Q2 earnings")


