What does tech chart indicate for TCS and Infosys ahead of Q3 nos?
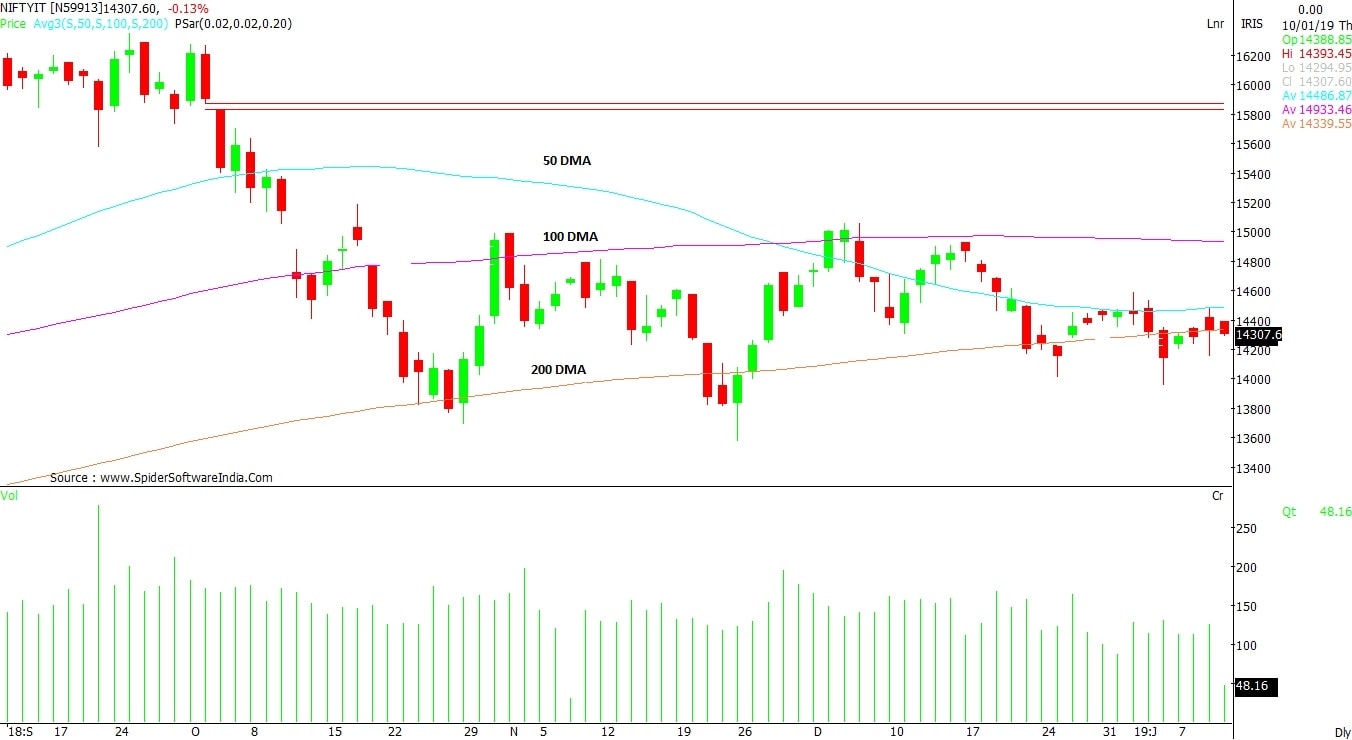
Currently, the 100-DMA is witnessing resistance as the price could not procure follow-up buying.
 "What does tech chart indicate for TCS and Infosys ahead of Q3 nos?")
premium
WebinarsNew
Deep DiveNew
Explore Business Standard
Currently, the 100-DMA is witnessing resistance as the price could not procure follow-up buying.
Already subscribed? Log in
Subscribe to read the full story →
3 Months
₹300/Month
1 Year
₹225/Month
2 Years
₹162/Month
Renews automatically, cancel anytime

Over 30 premium stories daily, handpicked by our editors


News, Games, Cooking, Audio, Wirecutter & The Athletic
Digital replica of our daily newspaper — with options to read, save, and share


Insights on markets, finance, politics, tech, and more delivered to your inbox
In-depth market analysis & insights with access to The Smart Investor


Repository of articles and publications dating back to 1997
Uninterrupted reading experience with no advertisements


Access Business Standard across devices — mobile, tablet, or PC, via web or app
First Published: Jan 10 2019 | 12:32 PM IST