Auto stocks were among the top losers in trades on Thursday after the US President Donald Trump said he would impose a 25 per cent tariff on all cars imported into the United States with effect from April 02 onwards.
Among individual stocks, Tata Motors was the worst hit, as the stock tanked 6.6 per cent to a low of Rs 661.
Analysts believe Trump's decision to levy 25 per cent duty on all cars imported will impact Tata Motors the most, as it exports a significant number of JLR cars to the US.
Even as the broader market recovered and traded on a positive note, with the Nifty up 0.5 per cent around 23,600 levels; the Nifty Auto index traded with a loss of nearly 1 per cent around 21,557 levels.
Against this background, here's a technical check on the Nifty Auto index and stocks of leading 3 car makers in India.
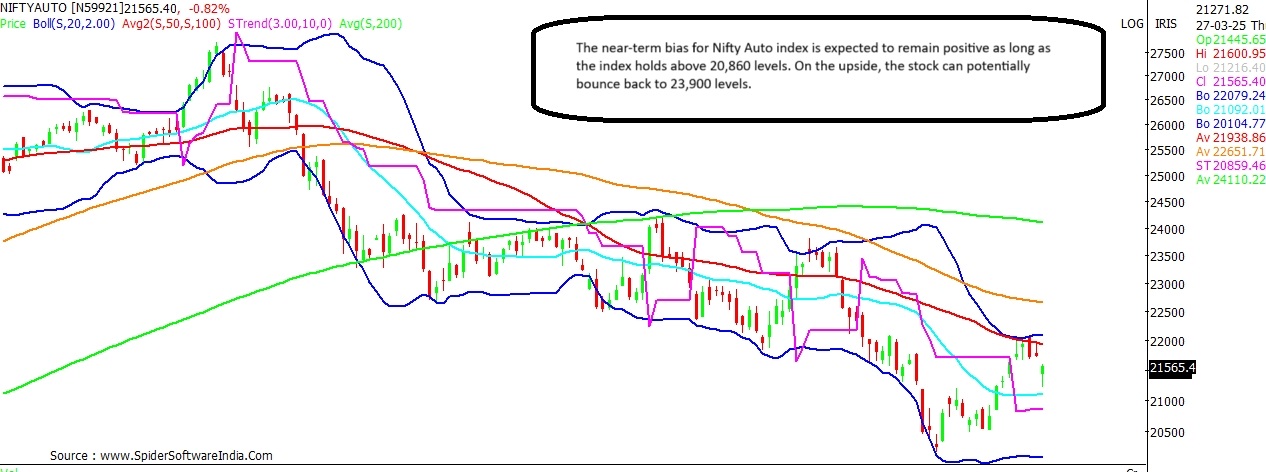
Nifty Auto Current Level: 21,557
Upside Potential: 10.9%
Downside Risk: 5.9%
Support: 21,100; 20,860
Resistance: 21,940; 22,080; 22,550; 22,650; 23,070
The Nifty Auto index is displaying a mixed bias across time-frames. In the near-term, the Auto index is likely to trade with a positive bias as long as the index holds above 20,860 levels, with near support seen at 21,100 levels. Similarly, the long-term monthly chart indicates that the overall bias for the Nifty Auto shall remain cautiously optimistic as long as the index remains above 20,280 levels.
CLICK HERE FOR THE CHART For now, the Nifty Auto index seems to have taken support around the 100-WMA (Weekly Moving Average) at 20,530-odd levels, and is attempting a pullback from oversold zones. Chart suggests the Auto index can potentially jump back to 23,900 levels - this implies an upside potential of nearly 11 per cent from present levels. Interim resistance for the index stands at 21,940, 22,080, 22,550, 22,650 and 23,070 levels.
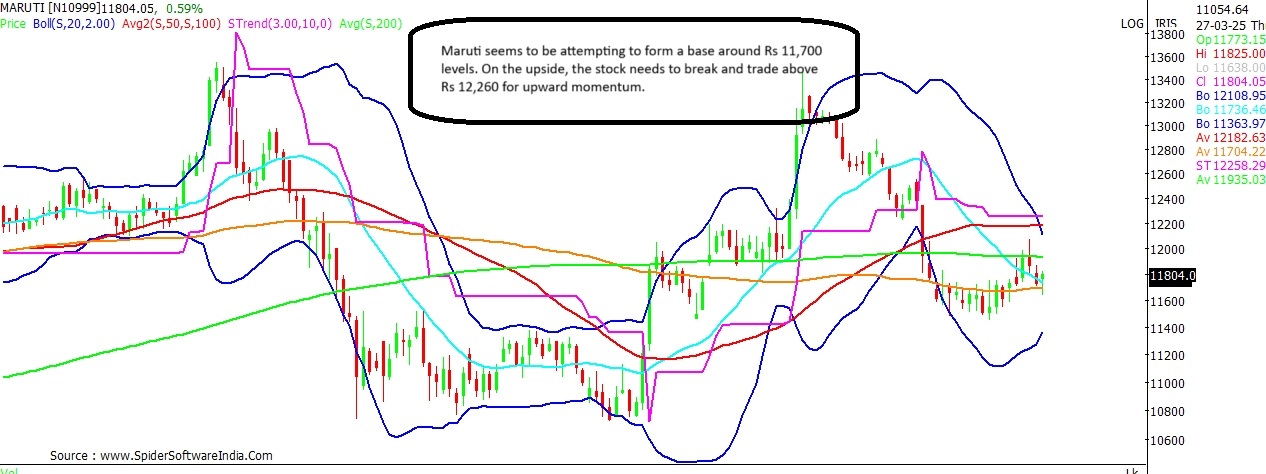
ALSO READ: Nifty Bank can hit new high, zoom to 57,000; Breakout, key levels to track Maruti Suzuki Current Price: ₹ 11,798
Upside Potential: 13.3%
Downside Risk: 7.2%
Support: ₹ 11,700; ₹ 11,340; ₹ 11,230
Resistance: ₹ 11,935; ₹ 12,100; ₹ 12,260
Even as Maruti Suzuki stock is trading below key moving averages on the daily scale; the stock seems to be favourably placed on the long-term charts. Maruti has been making higher-highs and higher-lows on the monthly scale since December 2020. In spite of the recent market fall, the stock managed to maintain this trend thus far.
The stock seems to have found support around the 20-MMA (Monthly Moving Average) which now stands at ₹ 11,230. For now, the stock is seen attempting to form a base around its 100-DMA (Daily Moving Average) at ₹ 11,700 levels; below which support for the stock exists at ₹ 11,340 and ₹ 10,950 levels.
On the upside, the stock has near resistance around its 200-DMA at ₹ 11,935 and ₹ 12,100 levels. Break and sustained trade above ₹ 12,260 shall see the stock gain upside momentum. As such the stock can potentially rally to ₹ 13,370 levels - above which new highs seem a possibility.
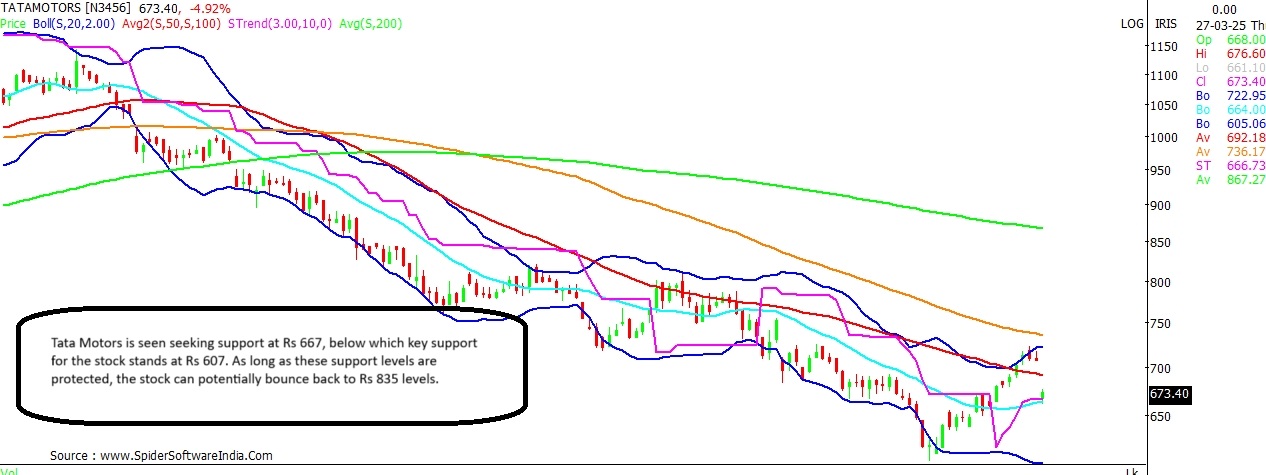
CLICK HERE FOR THE CHART Tata Motors Current Price: ₹ 674
Upside Potential: 23.9%
Support: ₹ 667; ₹ 607
Resistance: ₹ 690; ₹ 720; ₹ 780; ₹ 800
Following today's sharp 6.6 per cent fall, Tata Motors is seen seeking support around its super trend line, which stands at ₹ 667. The broader trend shows that the stock is fairly oversold, and recently sought support around the 100-WMA, which now stands at ₹ 607.
CLICK HERE FOR THE CHART Given the oversold condition, a relief rally at the counter cannot be ruled out. As such, the stock can potentially bounce back to ₹ 835 levels - with interim resistance likely around ₹ 690, ₹ 720, ₹ 780 and ₹ 800 levels.
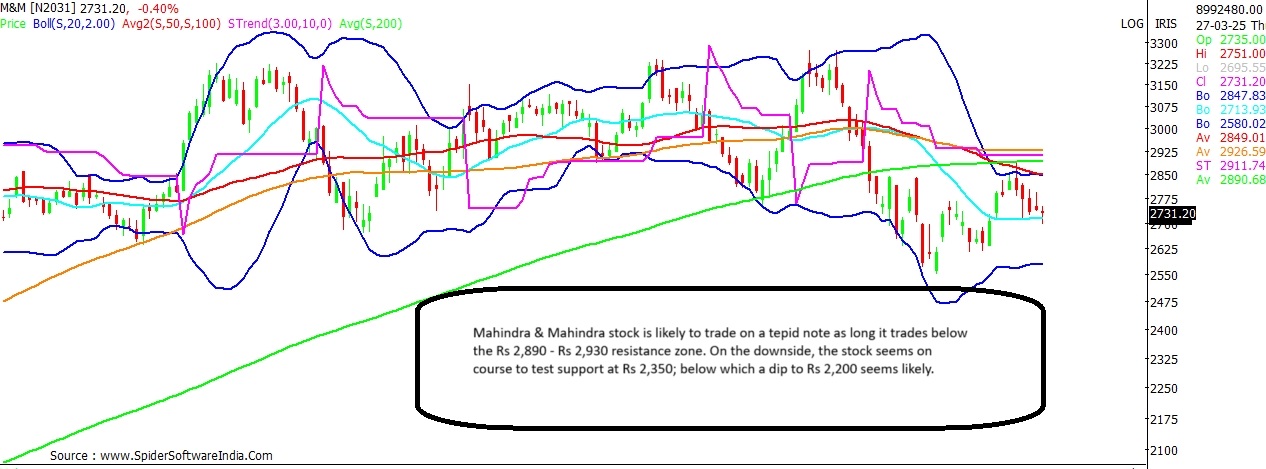
Mahindra & Mahindra (M&M) Current Price: ₹ 2,730
Downside Risk: 19.4%
Support: ₹ 2,350
Resistance: ₹ 2,850; ₹ 2,890; ₹ 2,930
M&M stock is likely to trade on a tepid note until it clears the ₹ 2,890 - ₹ 2,930 resistance zone; interim hurdle for the stock exists at ₹ 2,850. Chart shows that the stock seems on course to test support around its 20-MMA (Monthly Moving Average) around ₹ 2,350 levels, below which a dip towards the 100-WMA at ₹ 2,200 seems likely.
CLICK HERE FOR THE CHART ALSO READ: ICICI Bank, M&M charts flag Death Cross; here's what happened in the past On the daily scale, the stock witnessed formation of 'Death Cross' earlier this month. Technically, 'Death Cross' is a bearish development, where in the 50-DMA of the stock falls below the 200-DMA.
That apart, the 20- and 50-WMA (Weekly Moving Averages) are seen converging; a negative crossover could further weaken the chart set-up. The stock last witnessed a notable negative crossover of these moving averages in January 2019, post which the stock slumped by nearly 60 per cent.
 "Auto stocks can defy Trump tariff woes, may rally up to 24%; suggest charts")
