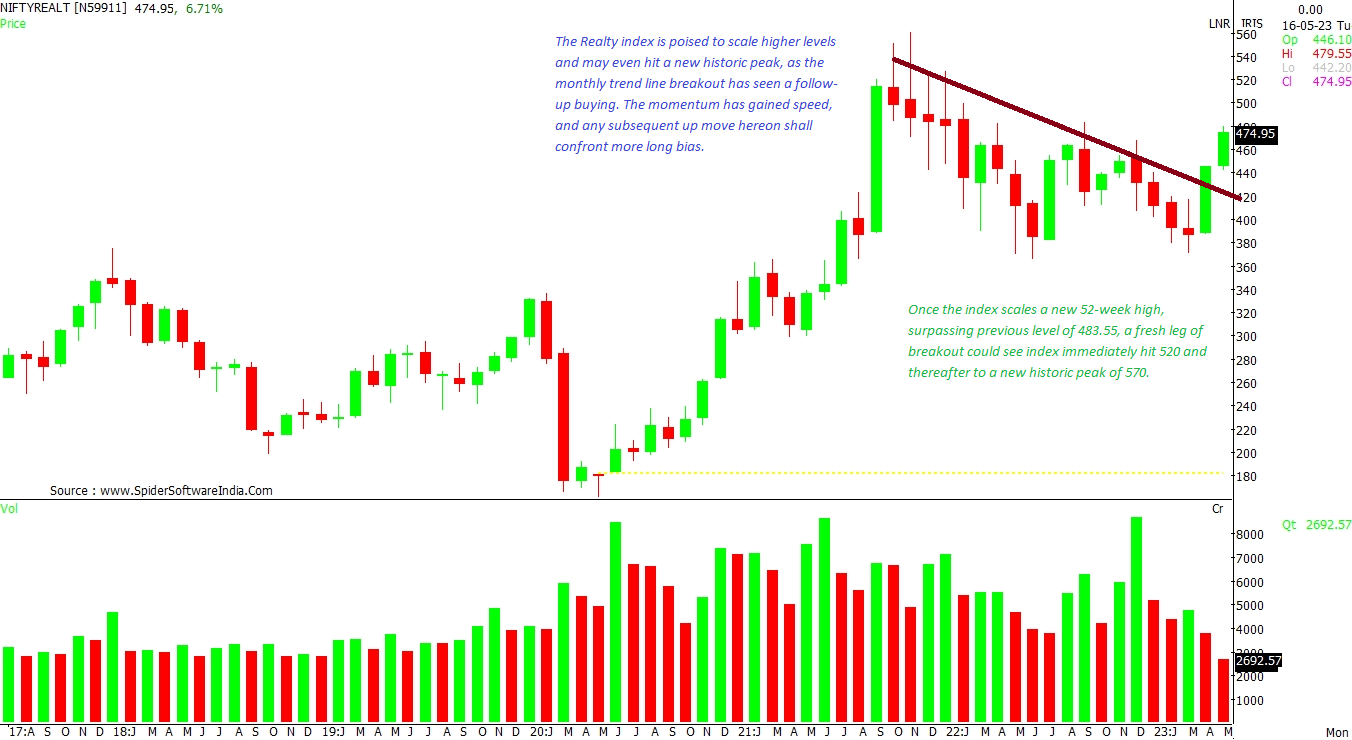
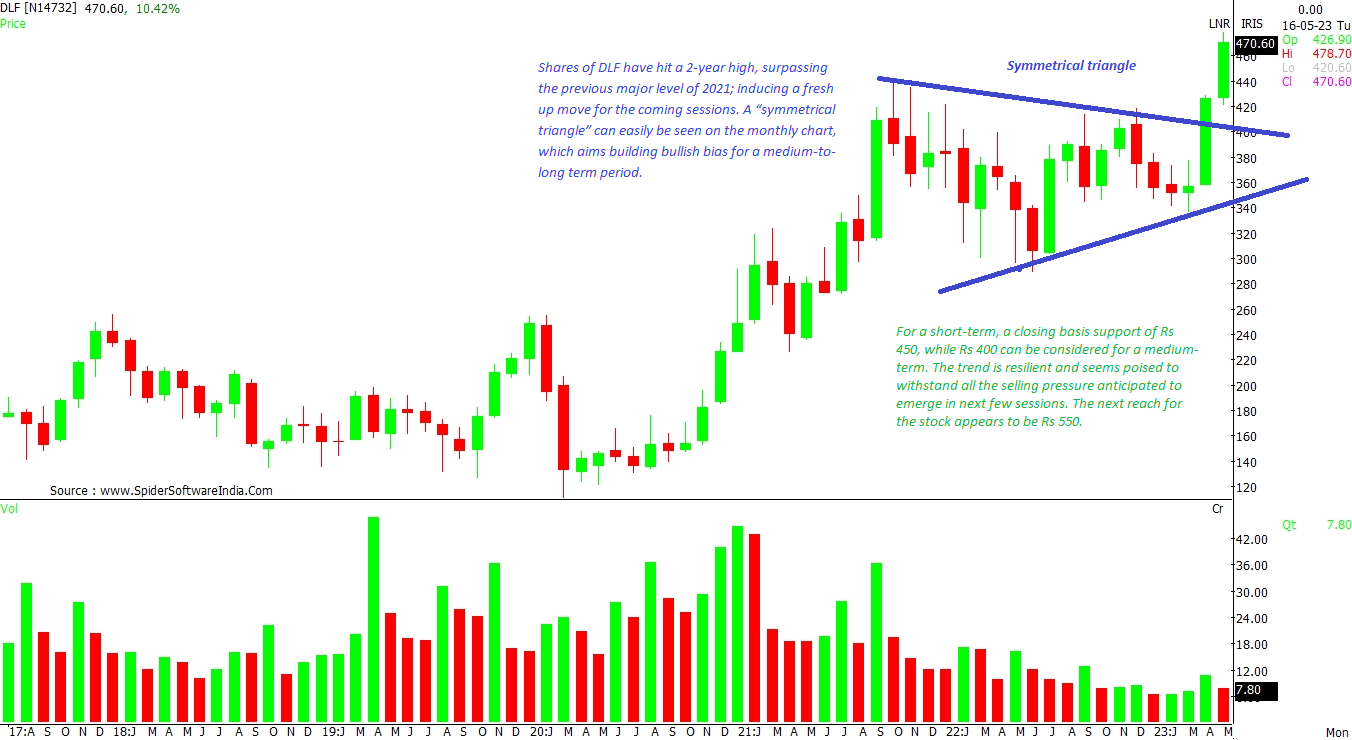
DLF, Sobha: Realty index can hit life-time peak if it conquers 484 level

When Nifty Realty index hits a new 52-week high, the next positive rally shall aim at setting a new all-time high

realty sector
Realty index to reach a new historic peak
Avdhut Bagkar Mumbai
4 min read Last Updated : May 16 2023 | 11:50 AM IST
Nifty realty index has decisively crossed 5-months high and is few points shy of setting a new 52-week. Technically, when critical levels are achieved, the next upside could reach a new all-time high. 

Shares of realty sector on Monday performed well on the bourses, with DLF and Sobha rolling 10 per cent gains, while Godrej Properties, Prestige Estates Projects, and Oberoi Realty advanced close to 5 per cent each.

On Tuesday, DLF, Godrej Properties and Indiabulls Real Estate continue their upward momentum, by surging over 1.50 per cen, respectively. 

Here’s the technical outlook for realty stocks amid a resilient momentum:-

NIFTY REALTY INDEX
Outlook: New 52-week high aims at fresh historic peak

The Realty index is poised to scale higher levels and may even hit a new historic peak, as the monthly trend line breakout has seen a follow-up buying. The momentum has gained speed, and any subsequent up move hereon shall confront more long bias.

The index trades firmly over the crucial 200-day moving average (DMA), set at 430 mark, which henceforth may be regarded as the major trend reversal for negative bias. 

Once the index scales a new 52-week high, surpassing previous level of 483.55, a fresh leg of breakout could see index immediately hit 520 and thereafter to a new historic peak of 570. CLICK HERE FOR THE CHART

DLF Ltd (DLF) 
Likely target: Rs 550
Upside potential: 17%

Shares of DLF have hit a 2-year high, surpassing the previous major level of 2021; inducing a fresh up move for the coming sessions. A “symmetrical triangle” can easily be seen on the monthly chart, which aims building bullish bias for a medium-to- long term period.

For a short-term, a closing basis support of Rs 450, while Rs 400 can be considered for a medium-term. The trend is resilient and seems poised to withstand all the selling pressure anticipated to emerge in next few sessions. The next reach for the stock appears to be Rs 550. CLICK HERE FOR THE CHART

Godrej Properties Ltd (GODREJPROP)
Likely target: Rs 1,550
Upside potential: 10%

Sustainability over the 200-DMA set at Rs 1,255 has propelled shares of Godrej Properties towards the next leg of breakout. The counter is witnessing aggressive strength over the previous crucial level of Rs 1,360, suggesting further upside in coming sessions. 

Until the supports of Rs 1,300 and Rs 1,250 are defended, the price action may rally towards Rs 1,550 level, as per the daily chart. The technical indicator RSI, categorically recognized as the strength indicator, has been sighting bullish price momentum in its overbought category, implying that the underlying strength is on the bulls’ side. CLICK HERE FOR THE CHART

Sobha Ltd (SOBHA)
Outlook: Set to conquer 200-DMA

While shares of Sobha are yet to claim the 200-DMA set at Rs 597-mark, it has managed to cross the 200-weekly moving average (WMA). This denotes that the trend on the larger time frame has moved in the bullish territory, which shall make smaller time frame to perform well in the short- term.

Immediate support for the stock exists at Rs 535 and Rs 490, which are its 100-DMA and 50-DMA, respectively. The volume has risen drastically in the last session and if the counter manages to hold the current momentum, more addition in volume cannot be ruled out.  CLICK HERE FOR THE CHART

Prestige Estates Projects Ltd (PRESTIGE)
Likely target: Rs 560
Upside potential: 10%

Shares of Prestige Estates Projects have hit a new 52-week high, propelling the next positive rally to reach a new all-time high of Rs 560. The current formations indicate a price movement in the direction of a positive crossover with the 200-DMA, and when that happens; the momentum and strength shall weigh the price action to scale bigger higher highs, as per the daily chart. The support for the stock exists at Rs 495 and Rs 485 levels. CLICK HERE FOR THE CHART

One subscription. Two world-class reads.

Already subscribed? Log in

Subscribe to read the full story →
*Subscribe to Business Standard digital and get complimentary access to The New York Times

Smart Quarterly

₹900

3 Months

₹300/Month

SAVE 25%

Smart Essential

₹2,700

1 Year

₹225/Month

SAVE 46%
*Complimentary New York Times access for the 2nd year will be given after 12 months

Super Saver

₹3,900

2 Years

₹162/Month

Subscribe

Renews automatically, cancel anytime

Here’s what’s included in our digital subscription plans

Exclusive premium stories online

  • Over 30 premium stories daily, handpicked by our editors

Complimentary Access to The New York Times

  • News, Games, Cooking, Audio, Wirecutter & The Athletic

Business Standard Epaper

  • Digital replica of our daily newspaper — with options to read, save, and share

Curated Newsletters

  • Insights on markets, finance, politics, tech, and more delivered to your inbox

Market Analysis & Investment Insights

  • In-depth market analysis & insights with access to The Smart Investor

Archives

  • Repository of articles and publications dating back to 1997

Ad-free Reading

  • Uninterrupted reading experience with no advertisements

Seamless Access Across All Devices

  • Access Business Standard across devices — mobile, tablet, or PC, via web or app

Topics :Nifty Realty IndexDLFGodrej Properties'RealtyBuzzing stocksstock market tradingStock CallTrading strategiestrading hoursChart Readingstocks technical analysisMarket technicalstechnical chartsDaily technicalstechnical callls

Next Story