This tech indicator triggered 100% rally in Nifty SmallCap; will it repeat?

The Nifty SmallCap index witnessed a 'Golden Crossover' on four occasions thus far in the past, with each resulting into a gain; historical chart shows a massive 110% rally post August 2020 breakout.

Indian equity benchmarks, Sensex gain, Nifty 50 index, Reliance Industries stock, FPI inflows India, foreign portfolio investors, market capitalization BSE, Indian stock market rally, Indian stock market growth, Reliance Industries rally, Sensex Nift
The Nifty SmallCap index witnessed a 'Golden Crossover' on four occasions thus far in the past, with each resulting into a gain; historical chart shows a massive 110% rally post August 2020 breakout.
Rex Cano Mumbai
3 min read Last Updated : Jul 04 2025 | 10:42 AM IST
The NSE Nifty SmallCap 250 index today witnessed the formation of 'Golden Cross' on the daily chart, with its 50-Day Moving Average (50-DMA) crossing over the 200-DMA from below. On Friday, in intra-day deals, the 50-DMA quoted around 16,666 levels, while the long-term 200-DMA stood at 16,632.  The 'Golden Cross' formation also commonly-known as 'Golden Crossover' was seen today, following the 'Death Cross' formation on February 5, 2025. CLICK HERE FOR THE CHART  The term 'Golden Cross' means that the shorter-term moving average - the 50-DMA has now crossed over the 200-DMA. Whereas, as and when the 50-DMA slips back below the 200-DMA, it is referred to as 'Death Cross' formation.  In general, a 'Golden Cross' or 'Golden Crossover' formation has bullish implications for the underlying index, with the short-term moving average which has moved up, implying support at higher levels.  History shows this is the fifth 'Golden Cross' formation on the Nifty SmallCap 250 index chart since its inception in January 2019. An analysis of the post such formations paints a bullish (positive) outlook for the Nifty SmallCap 250 index.  ALSO READ | Nifty Auto sees Golden Cross, 5 stocks with similar patterns; how to trade?  Barring the sudden dip post its maiden 'Golden Crossover' in January 2020 on account of the Covid-19 triggered panic sell-off, the Nifty SmallCap index has logged strong gains in the other three instances, before witnessing a reversal (Death Cross).  Thereafter, the Nifty SmallCap index witnessed a 'Golden Crossover' on August 25, 2020. The index from levels of around 5,009, rallied to then record highs of around 10,525 levels on January 18, 2022. This implied a stupendous gain of 110 per cent in mere 17 months.   
 
  The third 'Golden Cross' formation was witnessed on September 30, 2022 - the SmallCap index from levels of 9,199 jumped to a high of 9,894 on December 15, 2022 - up 7.6 per cent.  During its last instance, the Nifty SmallCap from levels of around 10,042 on June 2, 2023 surged to a record high of 18,688 on September 24, 2024 - thus registering a solid 86 per cent gain.  
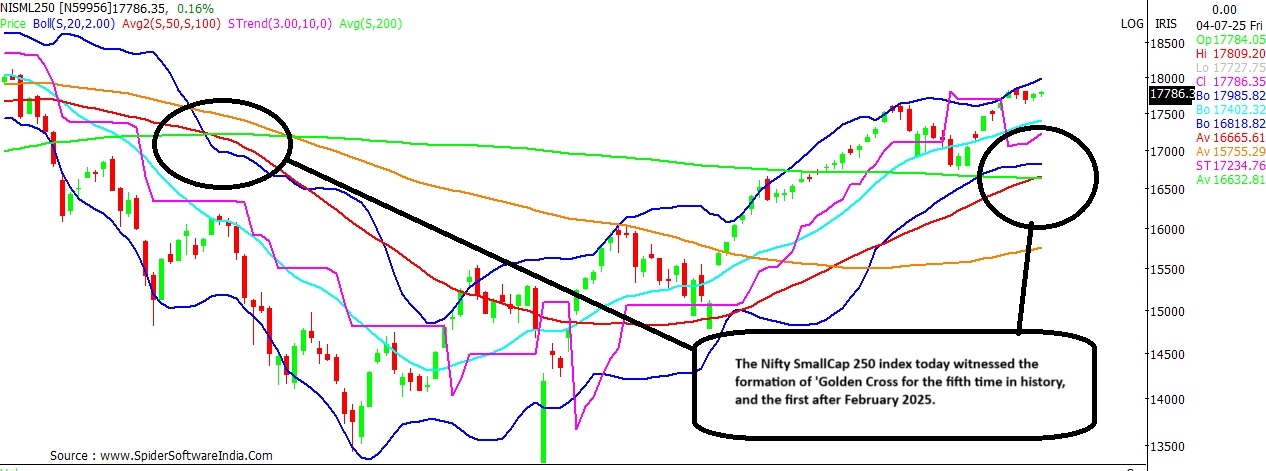
ALSO READ | Nifty chart shows Golden Cross formation; will its 6-year history hold?  Can history repeat itself? Here's what the current chart structure suggests for the Nifty SmallCap 250 index. 

Nifty SmallCap 250 Index

Current Level: 17,986  Likely Target: 21,000  Upside Potential: 16.8%  Support: 17,400; 17,235; 16,800; 15,800  Resistance: 18,200; 18,500; 19,030; 19,320; 20,212; 20,455  Technically, the Nifty SmallCap index looks favourably placed on the daily and weekly charts. The short-term bias for the index is likely to remain positive as long as the index holds above 17,235 levels; with near support likely around its 20-DMA which stands at 17,400 levels.  ALSO READ: 2 midcaps, 1 smallcap stock with up to 35% upside potential; check details  The broader chart suggests that the overall bias shall remain favourable as long as the SmallCap index sustains above 15,800 levels, with interim support seen at 16,800 levels.  On the upside, the Nifty SmallCap seems on course to test the trend line resistance on the monthly scale at 20,212 levels, with interim resistance likely around 18,200, 18,500, 19,030 and 19,320 levels. In the coming months, the SmallCap index can potentially extend the rally towards 21,000-mark, with intermediate resistance likely around 20,455 levels. 

One subscription. Two world-class reads.

Already subscribed? Log in

Subscribe to read the full story →
*Subscribe to Business Standard digital and get complimentary access to The New York Times

Smart Quarterly

₹900

3 Months

₹300/Month

SAVE 25%

Smart Essential

₹2,700

1 Year

₹225/Month

SAVE 46%
*Complimentary New York Times access for the 2nd year will be given after 12 months

Super Saver

₹3,900

2 Years

₹162/Month

Subscribe

Renews automatically, cancel anytime

Here’s what’s included in our digital subscription plans

Exclusive premium stories online

  • Over 30 premium stories daily, handpicked by our editors

Complimentary Access to The New York Times

  • News, Games, Cooking, Audio, Wirecutter & The Athletic

Business Standard Epaper

  • Digital replica of our daily newspaper — with options to read, save, and share

Curated Newsletters

  • Insights on markets, finance, politics, tech, and more delivered to your inbox

Market Analysis & Investment Insights

  • In-depth market analysis & insights with access to The Smart Investor

Archives

  • Repository of articles and publications dating back to 1997

Ad-free Reading

  • Uninterrupted reading experience with no advertisements

Seamless Access Across All Devices

  • Access Business Standard across devices — mobile, tablet, or PC, via web or app

Topics :Stock MarketSmallcap indexMarket technicalsThe Smart InvestorMarket trendsstock market tradingMarket Outlookstock marketsIndian stock marketshare markettechnical analysistechnical chartsMarketsTrading tipsstock market rally

Next Story