Shares of Fast Moving Consumer Goods (FMCG) are buzzing in trades for the last two trading sessions. The sectoral index - Nifty FMCG was among the top gainers on Monday, with select stocks gaining up to 6 per cent.
Today (Tuesday), thus far in early deals the Nifty FMCG index and sectoral stocks are seen trading on a subdued note. Will these stocks be able to catch investors fancy in the near-term or will they falter?
Here's a detailed technical outlook on the FMCG heavyweights - ITC, Hindustan Unilever and Dabur for the likely trend ahead.
ITC
Current Price: ₹416
Likely Target: ₹345
Downside Risk: 17%
Support: ₹408; ₹394; ₹380
Resistance: ₹428; 450
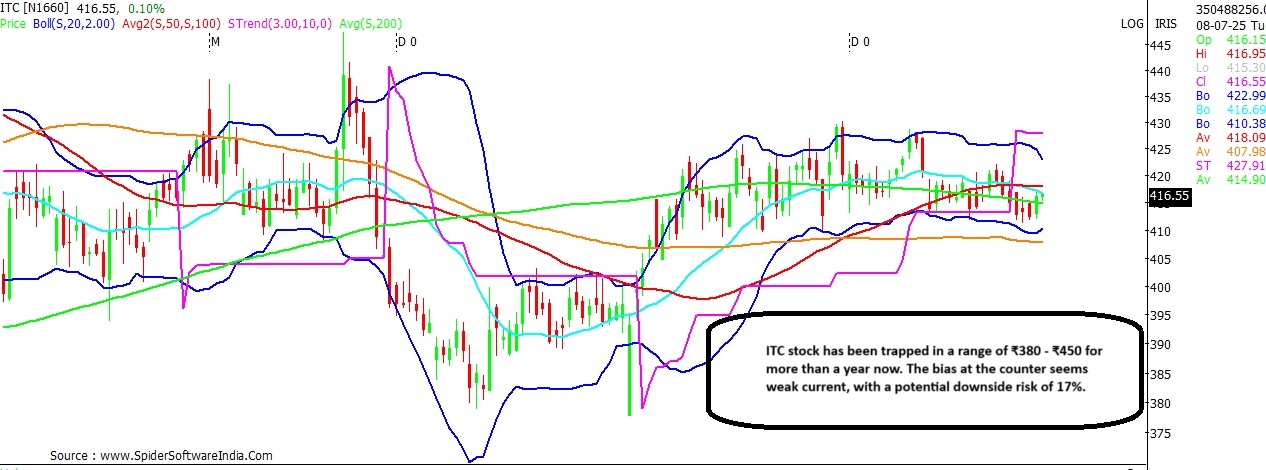
ITC stock has been trapped in the trading range of ₹380 - ₹450 for more than a year now. Over the last three months, the stock has been consistently finding support around its 100-Day Moving Average (100-DMA), but failing to break-out above the higher-end of the Bollinger Bands on the daily chart.
CLICK HERE FOR THE CHART Earlier this month (July), the near-term bias for ITC stock turned negative as it dipped below the trend line support. Technical chart suggests that the near-term bias for ITC is likely to be tepid as long as the stock trades below ₹428 levels. Whereas, the broader trend is likely to remain subdued as long as the stock quotes below ₹450 levels.
On the downside, ITC may re-visit the 100-DMA support, which now stands at ₹408; below which support for the stock exists at ₹394 and ₹380 levels. Break and sustained trade below ₹380 can trigger a potential slide towards ₹345 levels.
ALSO READ | JK Tyre, Timken among 5 smallcap stock ideas with upto 27% upside potential Hindustan Unilever (HUL)
Current Price: ₹2,407
Likely Target: ₹2,775
Upside Potential: 15.3%
Support: ₹2,383; ₹2,320
Resistance: ₹2,430; ₹2,510
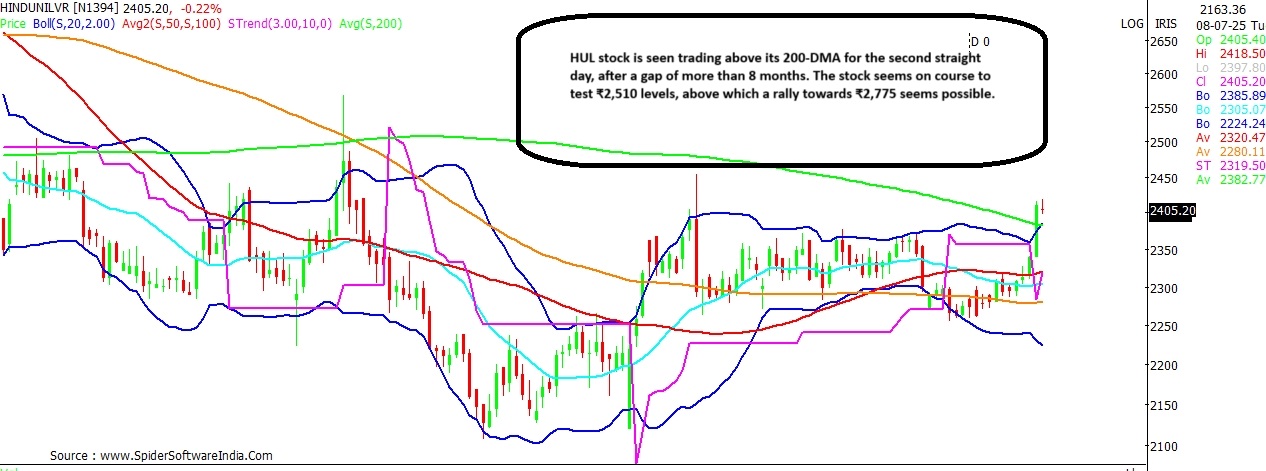
HUL stock is seen trading above its long-term 200-DMA for the second straight day, which now stands at ₹2,383, after a gap of more than 8 months. That apart the stock has also given a breakout above the super trend line. Thus, the near-term bias for the stock is likely to be favourable as long as the stock holds above ₹2,320 levels, with near support likely around its 200-DMA.
CLICK HERE FOR THE CHART On the upside, the stock seems on course to test the weekly super trend line resistance around ₹2,510 levels; with some interim resistance likely around ₹2,430 levels. Breakout and sustained trade above ₹2,510 can potentially trigger a rally towards ₹2,775 levels.
ALSO READ | Is the worst over for BluSmart cab parent company Gensol Engineering stock? Dabur
Current Price: ₹513
Likely Target: ₹630
Upside Potential: 22.8%
Support: ₹509; ₹488
Resistance: ₹514; ₹521; ₹535
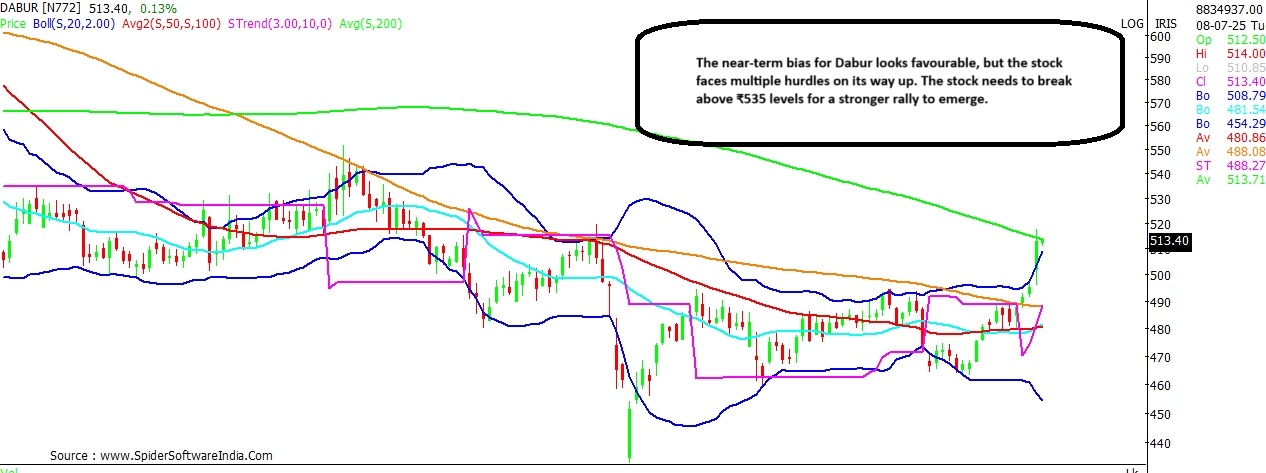
Dabur stock is seen testing its 200-DMA hurdle, which stands at ₹514, for the second straight day, after a gap of 8 months. Technically, the bias for the stock is positive, with near support seen at ₹509 and far-off support at ₹488 levels.
CLICK HERE FOR THE CHART At the same time, apart from the 200-DMA hurdle, the stock also faces an overhead resistance around ₹521 and ₹535 levels. In case, the stock manages to clear all these hurdles it shall then potentially rally towards ₹630 levels.
 "ITC vs HUL vs Dabur: Which is the best bet among these FMCG major shares?")


