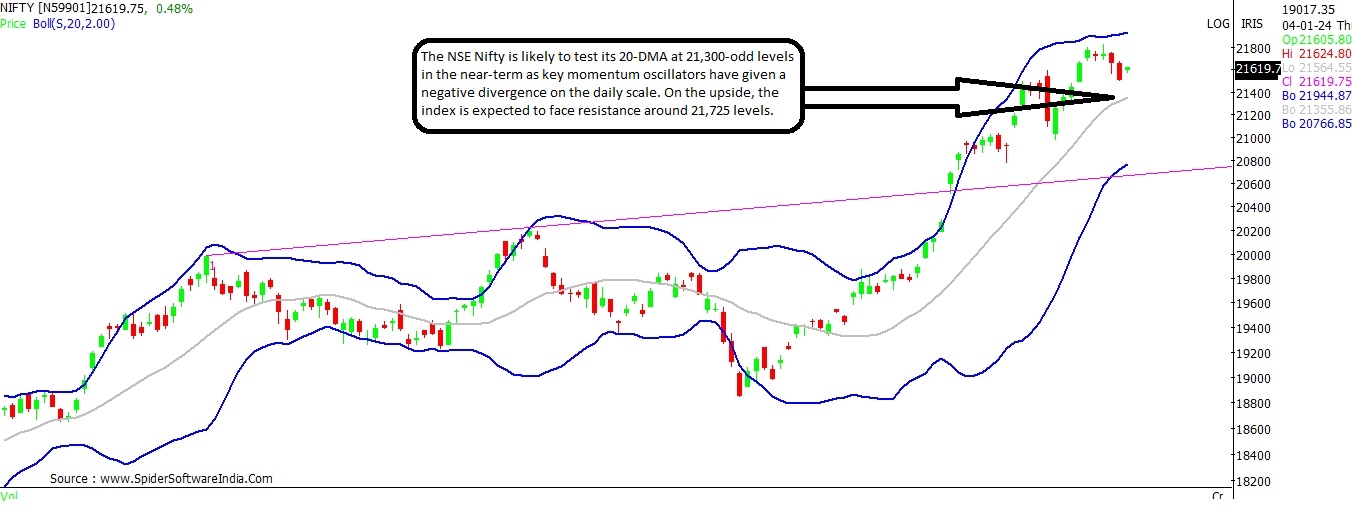
Nifty, Bank Nifty bounce back: Should you sell the rally? Check key levels

As talks of an impending market correction grow louder, here's a quick chart check on the Nifty 50 and key sectoral indices.

Buy, Sell, markets, stocks, shares, investments, mutual funds, investors
Rex Cano Mumbai
4 min read Last Updated : Jan 04 2024 | 10:58 AM IST
Equity benchmark indices have bounced back in trades on Thursday, after having started the New Year 2024 on a shaky note. The NSE Nifty 50 was up 120-odd points (0.6 per cent). Among key sectors, the Bank Nifty was up 0.5 per cent, while the Auto index added 0.2 per cent. The IT index, however, was flat.

The Nifty had declined 1 per cent in the previous two trading sessions. The fall was preceded by a 13 per cent rally in the last two months of 2023, and rise in India VIX (Volatility Index) to multi-month highs. 

As talks of an impending market correction grow louder, here's a quick chart check on the Nifty 50 and key sectoral indices for the likely direction and key levels to watch out for going ahead.

Nifty
Current Level: 21,610
Support: 21,325; 21,200
Resistance: 21,725

Given the strong gains in 2023, the price-to-moving averages action continues to remain favourable for the NSE Nifty 50 on multiple time-frames. However, the recent fall seems to be threatening of a more notable decline in the coming trading sessions.

The worrying part is that, among the key momentum oscillators - the MACD (Moving Average Convergence-Divergence) has turned negative for the first time since early November 2023. Further, the 14-day RSI (Relative Strength Index) too has confirmed a negative divergence for the first time since late October. 

Given this, for now, the Nifty seems on course to test its 20-DMA (Daily Moving Average) at 21,325-odd levels; below which the Nifty could seek support around its super trend line at 21,150-odd levels. Any violation of the same, could lead to a deeper fall towards 20,800 levels. 

One needs to remember that the Nifty has a significant gap of 200-odd points, between 20,300 to 20,500, which is likely to be filled at some point of time.

On the other hand, the structure of the weekly chart remains strong, with some resistance expected around 21,725 levels. Whereas, the monthly chart suggests that the index needs to close above 21,500 on the monthly-scale in order to maintain its upward momentum. CLICK HERE FOR THE CHART

Bank Nifty
Current Level: 47,880
Support: 46,840; 46,640
Resistance: 48,600

The Bank Nifty has been testing support at its 20-DMA, which stands at 47,720, for the last three trading sessions. Going forward, the index may break this support as the key momentum oscillators like the RSI, MACD and Stochastic Slow are all negative.

On the downside, the Bank Nifty could test support around 46,840 followed by 46,640, shows the daily chart. For now, the upside seems to be capped around 48,600 levels. CLICK HERE FOR THE CHART

Nifty IT
Current Level: 34,340
Support: 33,730; 32,800
Resistance; 34,740 

The Nifty IT index is seen trading below its 20-DMA for the last two trading days. The 20-DMA at 34,740 levels is likely to act as an immediate hurdle for the index going forward.

On the downside, the index seems headed towards its super trend line support at 33,730 levels, below which the next significant support for the IT index is seen at 32,800 levels. 

On the upside, as and when the index, climbs back above the 20-DMA it can jump towards 35,850. CLICK HERE FOR THE CHART

Nifty Auto
Current Level: 18,315
Support: 18,040; 17,820; 17,420
Resistance: 18,585; 18,660

The Nifty Auto index seems to be consolidating between its 20-DMA and the higher-end of the Bollinger Bands, indicating a trading range of 18,040 - 18,660. Select momentum oscillators seem to have turned negative, but the momentum seems to be lacking.

Having said that, the weekly chart is developing some negative divergence. Hence, one needs to keep a close watch out for 18,565 levels on the upside. Failure to cross and sustain above the same, could put downward pressure on the index.

On the downside, below 20-DMA, the Nifty Auto index could potentially slide to 17,820 and 17,420 levels, shows the daily chart. CLICK HERE FOR THE CHART

One subscription. Two world-class reads.

Already subscribed? Log in

Subscribe to read the full story →
*Subscribe to Business Standard digital and get complimentary access to The New York Times

Smart Quarterly

₹900

3 Months

₹300/Month

SAVE 25%

Smart Essential

₹2,700

1 Year

₹225/Month

SAVE 46%
*Complimentary New York Times access for the 2nd year will be given after 12 months

Super Saver

₹3,900

2 Years

₹162/Month

Subscribe

Renews automatically, cancel anytime

Here’s what’s included in our digital subscription plans

Exclusive premium stories online

  • Over 30 premium stories daily, handpicked by our editors

Complimentary Access to The New York Times

  • News, Games, Cooking, Audio, Wirecutter & The Athletic

Business Standard Epaper

  • Digital replica of our daily newspaper — with options to read, save, and share

Curated Newsletters

  • Insights on markets, finance, politics, tech, and more delivered to your inbox

Market Analysis & Investment Insights

  • In-depth market analysis & insights with access to The Smart Investor

Archives

  • Repository of articles and publications dating back to 1997

Ad-free Reading

  • Uninterrupted reading experience with no advertisements

Seamless Access Across All Devices

  • Access Business Standard across devices — mobile, tablet, or PC, via web or app

Topics :Market OutlookTrading strategiesMarket technicalsNifty OutlookBank NiftyNifty IT IndexNifty Auto indextechnical analysistechnical charts

Next Story