The National Stock Exchange (NSE) benchmark
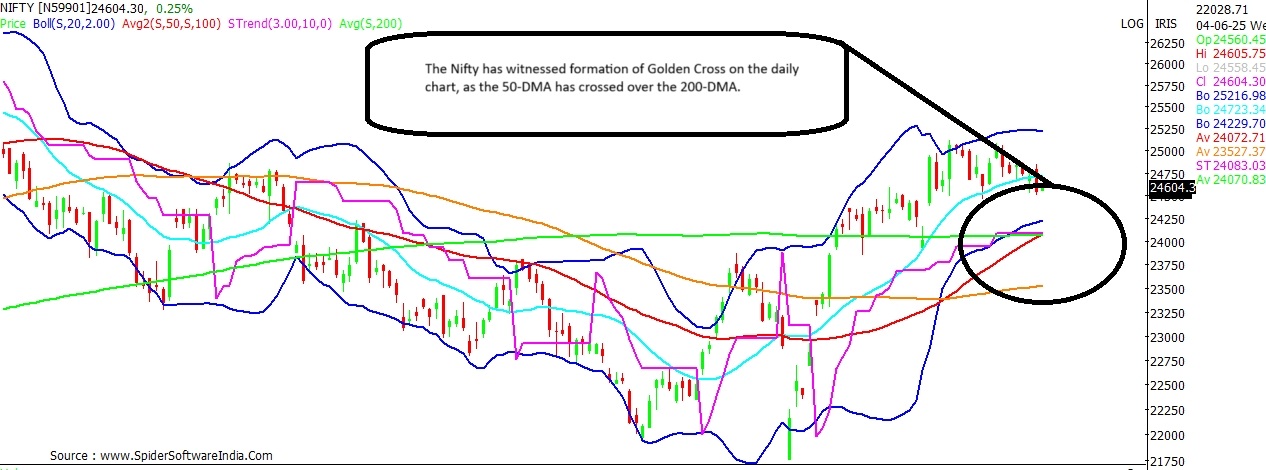
Nifty 50 index today, June 4, 2025, witnessed the formation of 'Golden Cross' on the daily chart.
Technically, the term 'Golden Cross' means that the short-term 50-Day Moving Average (50-DMA) has now crossed over the 200-DMA on the Nifty chart. The Golden Crossover in general has bullish implications for the underlying stock or index.
The Nifty's 50-DMA now quotes at 24,073, while the 200-DMA at 24,071.
CLICK HERE FOR THE CHART Historical chart pattern shows that, post formation of 'Golden Cross' also commonly known as Golden Crossover, the NSE Nifty 50 index has hit a new life-time high in each of the last five occasions before witnessing a 'Death Cross' formation on the daily chart.
ALSO READ | SBI, BoB, Canara Bank shares aim for new highs this June; can they make it happen? In the previous instance, i.e. after the Nifty saw formation of 'Golden Cross' on June 1, 2023, the NSE benchmark index went on to rally from levels of 18,500 to a record high of 26,277 on September 27, 2024 - thus registered a solid rally of 42 per cent.
The average gains for the Nifty in the last five occasions, i.e. since 2018, after formation of the 'Golden Cross' pattern, stands at hefty 24.4 per cent, shows historical study.
Ajit Mishra, SVP Research at Religare Broking reckons that Nifty has hit a new high on almost all the occasions after witnessing a Golden Crossover, barring one instance in March 2012; wherein the index failed to hit a new high, and instead witnessed a 'Death Cross' formation.
Technically, 'Death Cross' formation is the inverse of 'Golden Cross' as the 50-DMA of the stock or the underlying index slips below the 200-DMA.
ALSO READ | Reliance, Dixon, 10 other stocks form 'Golden Cross'; check list Ajit Mishra believes that history can be repeated, and the Nifty can potentially rally to record high levels this time as well. The Nifty 50 index can potentially zoom towards 26,500 levels, as and when it breaks above 25,600 levels, Ajit said.
At present levels the NSE Nifty 50 index is 6.9 away from its life-time high hit in September 2024.
Among other key levels, the Nifty chart shows presence of considerable support around 24,080 levels, close to the 200-DMA; below which next major support stands at 23,530 levels - the 100-DMA. Above 25,600 levels; intermediate hurdles for the Nifty exist at 25,900 and around its previous high 26,200 levels, shows the technical chart.
 "Nifty chart shows Golden Cross formation; will its 6-year history hold?")


