Home / Markets / News / Nifty SmallCap up 16% in 1 month; key levels to watch on overbought stocks
Nifty SmallCap up 16% in 1 month; key levels to watch on overbought stocks
Apar Industries, CESC, Glenmark, Jubilant Pharma and Power India are trading in overbought zone; charts suggest bias to remain positive as long as these support levels hold.
4 min read Last Updated : Apr 09 2024 | 12:59 PM IST
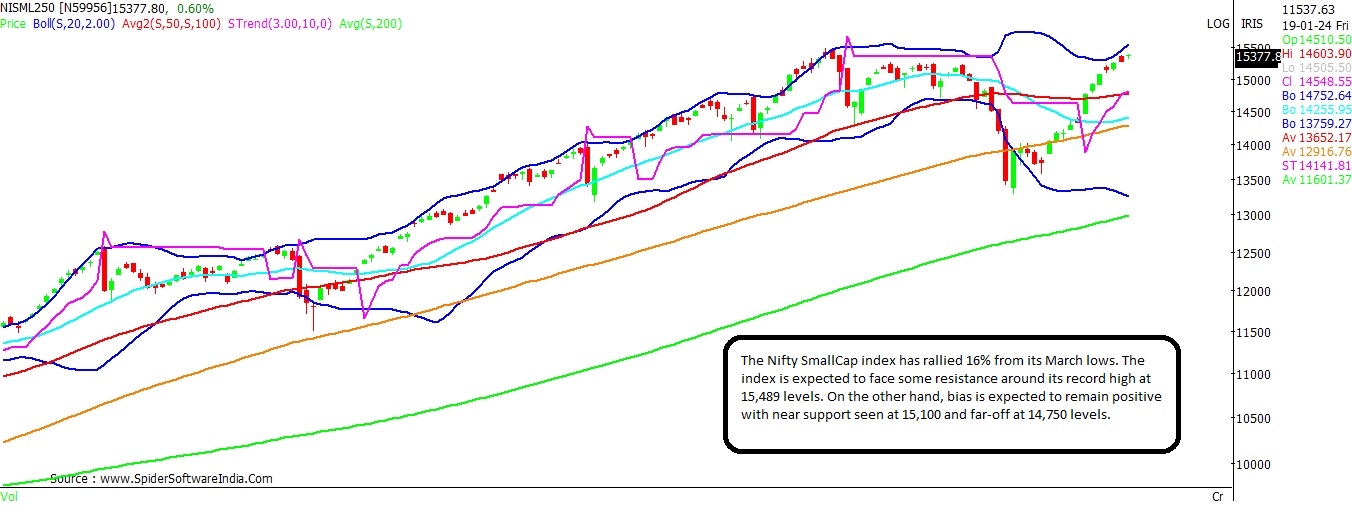
As bulls continue to roar on the Dalal Street, apart from the benchmark indices scaling new summits, the broader indices too have registered new life-time highs in recent days.
The NSE Nifty SmallCap index has hit a new peak of 15,374 in trades on Monday surpassing its earlier high of 15,489 hit on February 07. In the interim period, the index had tumbled to a low of 13,284 on March 14 - down over 14 per cent from its then peak - amid Sebi's clampdown on the smallcap segment.
The market regulator, Sebi, in March has asked mutual funds to conduct stress test on mid- and small-cap funds with a view to be prepared to protect retail investors in times of market volatility. The test results varied, with few funds reporting that it may require up to 22 days to liquidate 50 per cent of its holdings in smallcap schemes.
However, renewed investor interest and steady flows have helped the Nifty SmallCap index recoup all its losses in less than a month.
Given the recent sharp rally, up 16 per cent from the lows, select SmallCap stocks have entered overbought zones on the technical charts.
Here's a trading guide on select overbought smallcap stocks:
Nifty SmallCap
Current Level: 15,390
Support: 15,100; 14,750
Resistance: 15,489
The Nifty SmallCap index has rallied nearly 16 per cent from its March low. The index is barely 0.6 per cent shy from its record high. The index is expected to face some resistance around its highs. On the downside, the index needs to sustain above 15,100 levels, in order to maintain the pullback trend. Failing which, the Nifty SmallCap index may dip back to 14,750 levels. CLICK HERE FOR THE CHART
The stock has rallied almost 35 per cent from its recent low of Rs 5,503 on March 14. The stock is trading firmly above its key moving averages on the all time-frames. The stock has been a considerable outperformer since March 2022, having gained a whopping 12-fold from levels of Rs 620.
On the weekly scale, the stock has consistently made higher tops and higher lows. Charts suggest that the bias shall remain bullish above Rs 7,250 levels. However, break and sustained trade below the same can trigger a fresh price correction, wherein the stock may attempt to make a higher low around Rs 6,500 levels. In the long-term, the stock can potentially test Rs 8,200 levels. CLICK HERE FOR THE CHART
CESC
Current Price: Rs 143
Potential Upside: 7%
Support: Rs 141
CESC has gained over 31 per cent in its recent rally. The stock is presently trading above the higher-end of the Bollinger Bands on the daily scale, suggesting near support at Rs 141.50. On the upside, the stock has near resistance at Rs 147.50, above which it can potentially rally to Rs 153 in the near-term. CLICK HERE FOR THE CHART
Glenmark
Current Price: Rs 1,047
Potential Upside: 7.5%
Support: Rs 1,040; Rs 1,025; Rs 980
Glenmark is expected to trade on a buoyant note as long as it sustains above its near-term support at Rs 1,040 levels, below which the next key support levels stand at Rs 1,025 and Rs 980. On the upside, the stock seems on course to test Rs 1,125 levels. CLICK HERE FOR THE CHART
Jubilant Pharma
Current Price: Rs 658
Potential Upside: 9.2%
Support: Rs 650
Jubilant Pharma is seen trading above the higher-end of the Bollinger Bands on the daily scale for the fourth straight day. The near term bias is likely to remain upbeat as long as the stock holds above Rs 650. On the upside, the stock has near resistance at Rs 662, above which the stock can potentially rally to Rs 720 levels. CLICK HERE FOR THE CHART
Power India
Current Price: Rs 7,800
Key support: Rs 7,050
Power India has witnessed a phenomenal run of nearly 90 per cent in the last six months. The stock has consistently closed above the higher-end of the Bollinger Bands on a monthly scale in this period. At present levels, charts show that the overall trend is expected to remain bullish as long as the stock holds above Rs 7,050 levels.
In the near-term, bullish pivot for the stock is placed at Rs 7,630 levels. The stock trades in unchartered territory, hence one should remain cautious at higher levels. CLICK HERE FOR THE CHART