Paytm outlook: How much can the stock fall? Chart says this

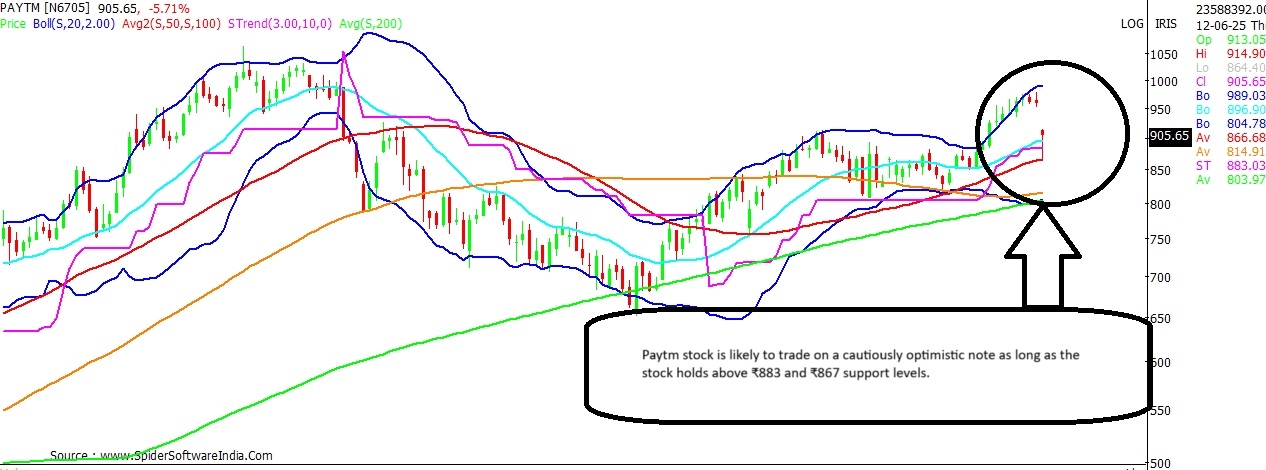
Technical chart shows that bias for Paytm stock is likely to remain cautiously optimistic as long as the stock manages to close above ₹883. Here are the key levels to track.

share market, stock market
Paytm stock can potentially fall to ₹804 levels, if support at ₹883 is violated; shows technical chart.
Rex Cano Mumbai
2 min read Last Updated : Jun 12 2025 | 11:20 AM IST
Paytm stock witnessed its biggest intra-day fall in 16 months, as the stock tanked 10 per cent following reports of government rebuttal on talks of UPI charges. 
    The Finance Ministry on Wednesday in a social media post called reports on a likely fee on UPI transactions as "completely false, baseless, and misleading".  "Speculation and claims that the MDR will be charged on UPI transactions are completely false, baseless, and misleading," the ministry stated in a post on social media platform X. MDR stands for Merchant Discount Rates.  Meanwhile, on the NSE the Paytm stock hit an intra-day low of ₹864, and saw trades of around 16.60 million shares so far on Thursday. READ MORE  Will this news flow, trigger a further fall at the Paytm counter or can the stock withstand the likely selling pressure? Here's what the technical chart indicates for the stock. 

Paytm

Current Price: ₹903  Upside Potential: 9.9%  Downside Risk: 11%  Support: ₹883; ₹867  Resistance: ₹992  Amid Thursday's fall, Paytm stock briefly dipped below its trend line support, which stands at ₹883, and found support around its 50-Day Moving Average, which stands at ₹867. This suggests that the near-term bias at the counter is likely to remain cautiously optimistic as long as the stock holds above these 2 near-term support levels. CLICK HERE FOR THE CHART  The short-term bias shall turn negative, as and when the stock registers a close below ₹883. Following which, a dip towards its long-term moving average - the 200-DMA, which stands at ₹804 levels, cannot be ruled out.  ALSO READ | This tech indicator turns positive for these 3 IT stocks; details here  For now, the mood at the counter is likely to remain cautious as the key momentum oscillators on the daily scale have turned negative, and the stock has been facing resistance around its weekly trend line for the last two weeks. The key weekly trend line resistance stands at ₹992. Thus, technical chart suggests a likely trading range of ₹867 - ₹992 for Paytm stock as of now. A breakout in either direction can unveil a fresh bias.  ALSO READ: Paytm stock crashes 10%, sharpest intra-day fall in 16 months; here's why 

One subscription. Two world-class reads.

Already subscribed? Log in

Subscribe to read the full story →
*Subscribe to Business Standard digital and get complimentary access to The New York Times

Smart Quarterly

₹900

3 Months

₹300/Month

SAVE 25%

Smart Essential

₹2,700

1 Year

₹225/Month

SAVE 46%
*Complimentary New York Times access for the 2nd year will be given after 12 months

Super Saver

₹3,900

2 Years

₹162/Month

Subscribe

Renews automatically, cancel anytime

Here’s what’s included in our digital subscription plans

Exclusive premium stories online

  • Over 30 premium stories daily, handpicked by our editors

Complimentary Access to The New York Times

  • News, Games, Cooking, Audio, Wirecutter & The Athletic

Business Standard Epaper

  • Digital replica of our daily newspaper — with options to read, save, and share

Curated Newsletters

  • Insights on markets, finance, politics, tech, and more delivered to your inbox

Market Analysis & Investment Insights

  • In-depth market analysis & insights with access to The Smart Investor

Archives

  • Repository of articles and publications dating back to 1997

Ad-free Reading

  • Uninterrupted reading experience with no advertisements

Seamless Access Across All Devices

  • Access Business Standard across devices — mobile, tablet, or PC, via web or app

Topics :PaytmTrading strategiesStocks to avoidStocks in focusStock ideasThe Smart InvestorStocks to buyStock tipsStock Recommendationsstocks technical analysistechnical callstechnical charts

Next Story