So, is the rally here to stay? Here's what charts suggest:
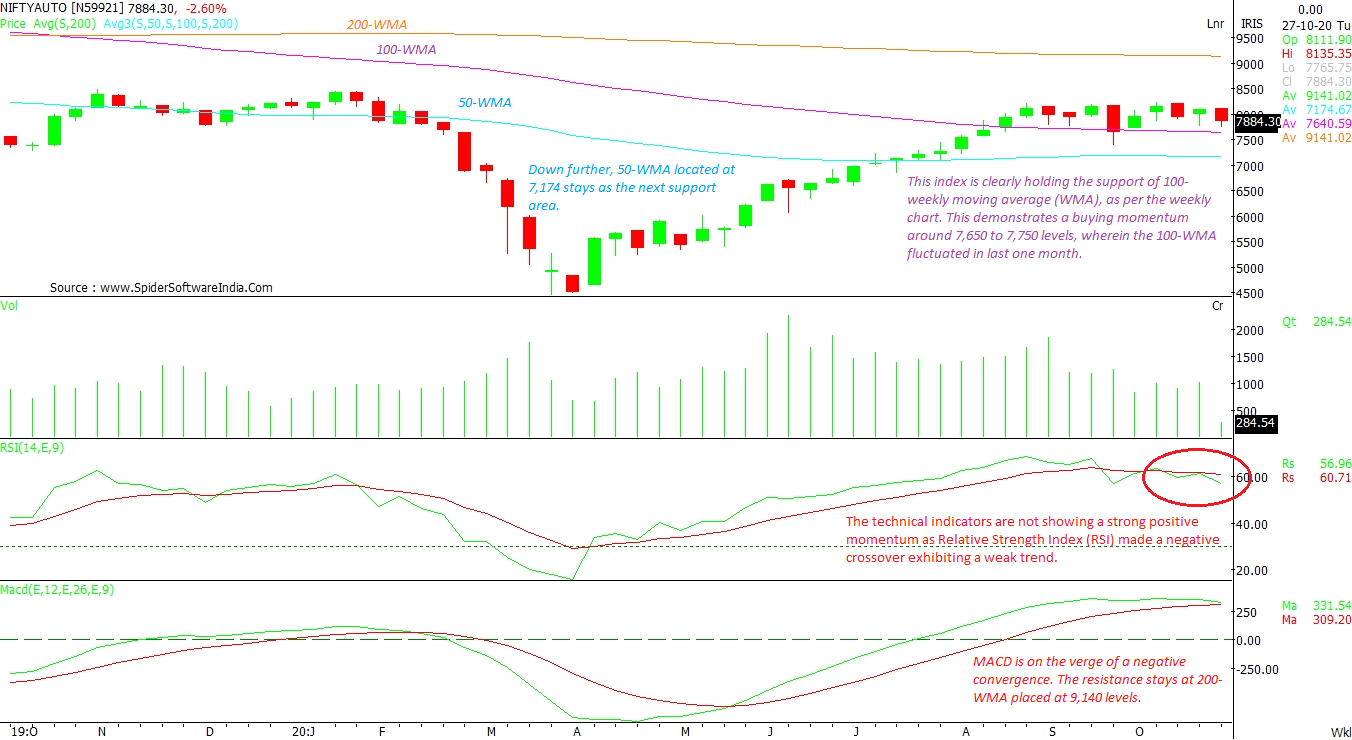
NIFTYAUTO: The index is holding the support of 100-weekly moving average (WMA), as per weekly charts. This demonstrates buying momentum around 7,650 to 7,750 levels, where the 100-WMA fluctuated in the previous month. On the downside, 50-WMA is placed at 7,174, which will act as the next support area. The technical indicators are not showing a strong positive momentum as Relative Strength Index (RSI) -- a metric to gauge bullish or bearish price momentum -- made a negative crossover exhibiting a weak trend. The Moving Average Convergence Divergence (MACD), too, is on the verge of a negative convergence. Key resistance for the index is placed at 200-WMA at 9,140 levels.
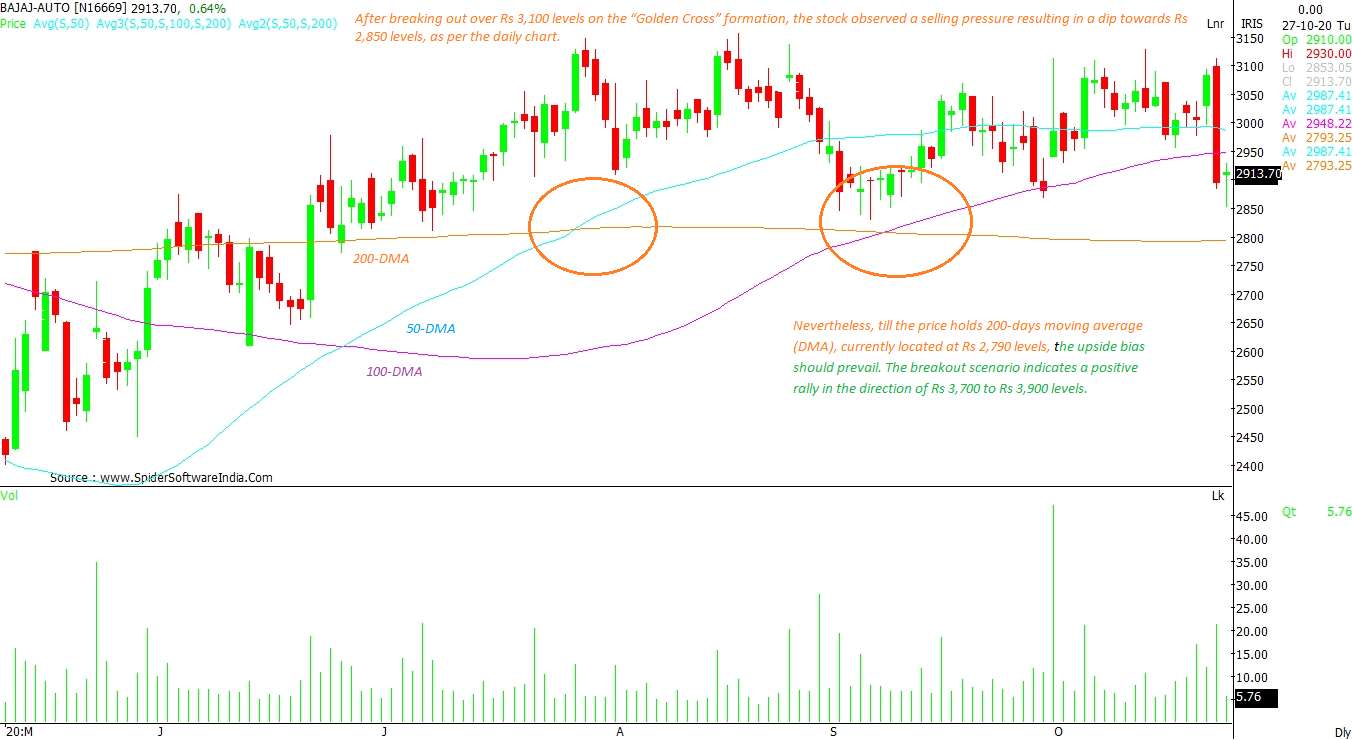
CLICK HERE FOR THE CHART Bajaj Auto Ltd (BAJAJA-AUTO): After a break-out above Rs 3,100 levels on the "Golden Cross" formation, the stock came under selling pressure, resulting in a dip towards Rs 2,850 levels, daily chart shows. That said, till the price stays above 200-days moving average (DMA), currently located at Rs 2,790 levels, the upside bias should prevail. The breakout scenario indicates a positive rally in the direction of Rs 3,700 to Rs 3,900 levels.
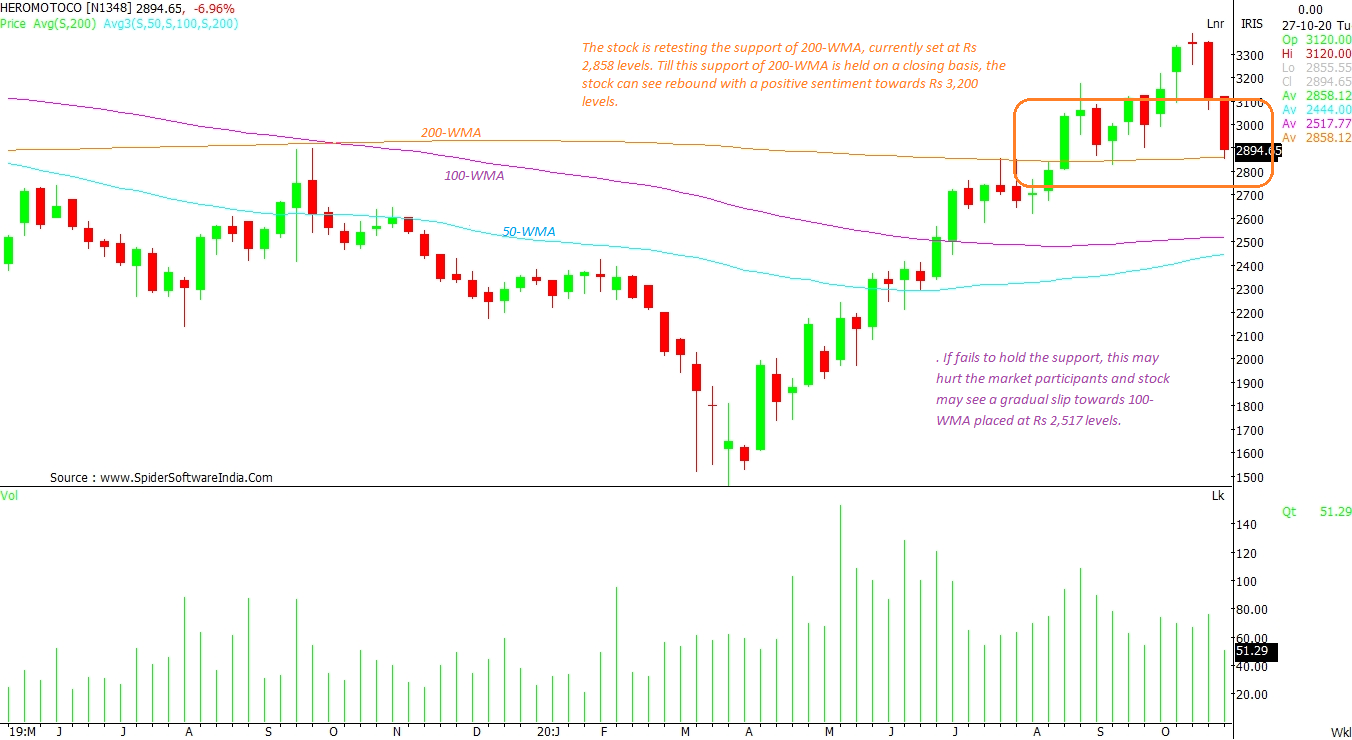
CLICK HERE FOR THE CHART Hero MotoCorp Ltd (HEROMOTOCO): The stock is re-testing the support of 200-WMA, currently set at Rs 2,858 levels. Till this support of 200-WMA is held on a closing basis, the stock can see rebound with a positive sentiment towards Rs 3,200 levels. Any failure to hold the support may hurt the market participants and stock may see a gradual slip towards 100-WMA placed at Rs 2,517 levels.
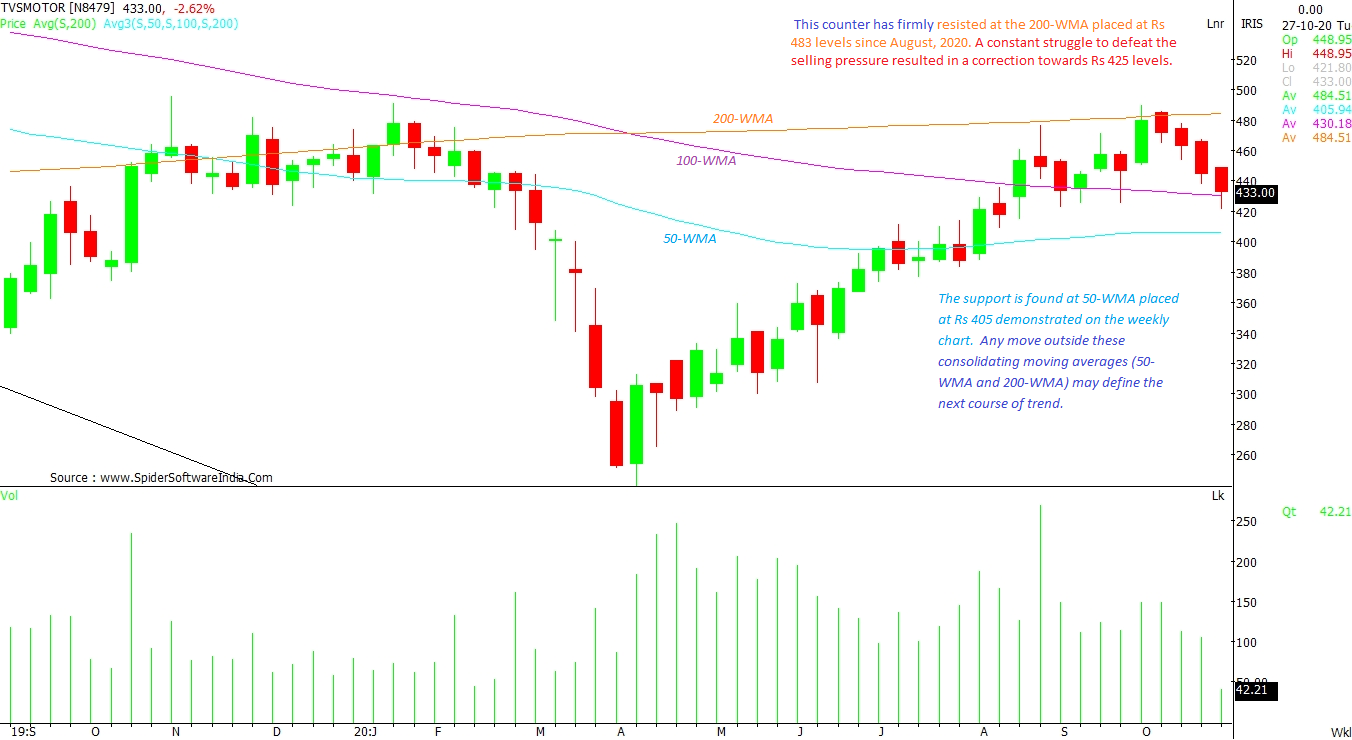
CLICK HERE FOR THE CHART TVS Motor Company Limited (TVSMOTOR): The counter is witnessing firm resistance at the 200-WMA placed at Rs 483 levels since August, 2020. A constant struggle to defeat the selling pressure resulted in a correction towards Rs 425 levels. The support now is found at 50-WMA placed at Rs 405, as per weekly chart. Any move outside these consolidating moving averages (50-WMA and 200-WMA) may define the next course of trend..
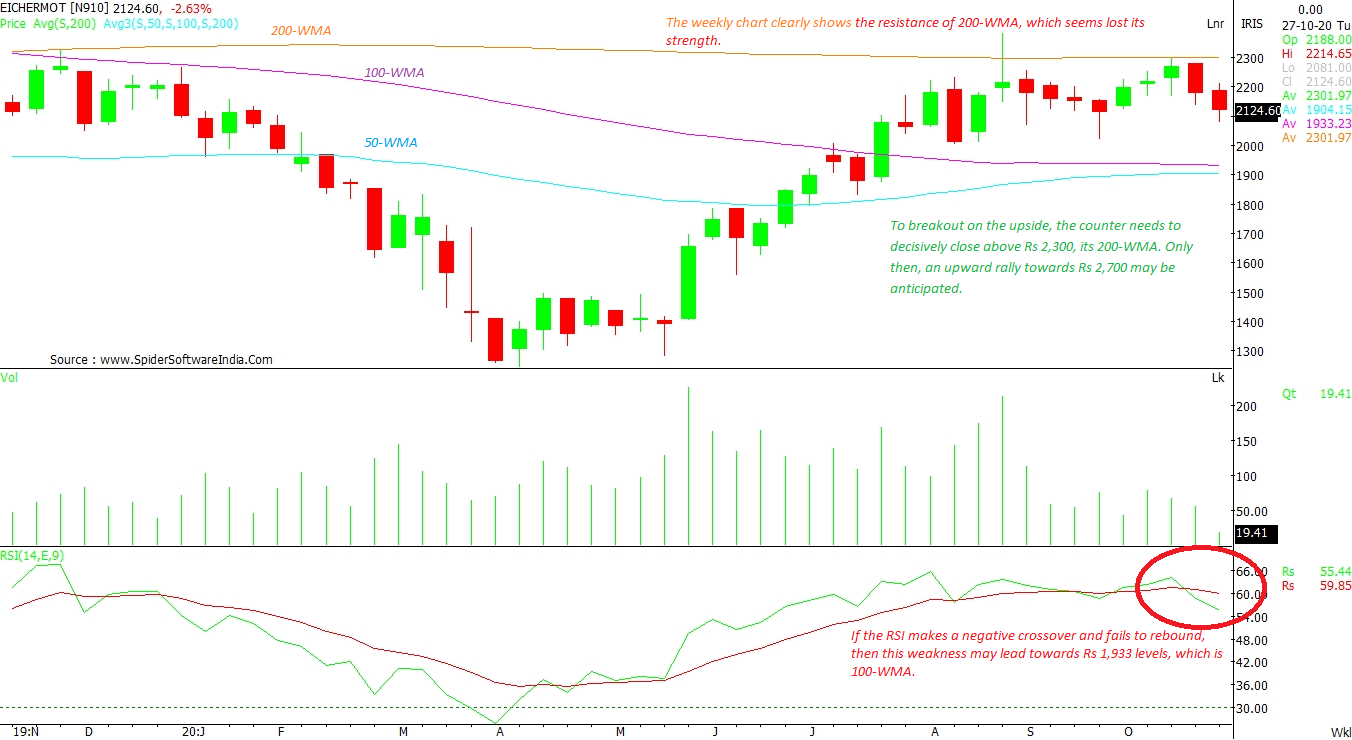
CLICK HERE FOR THE CHART Eicher Motors Ltd (EICHERMOT): The weekly chart clearly shows the resistance of 200-WMA, which hints at consistent weakening of strength. If the RSI makes a negative crossover and fails to rebound, then the weakness may drag the stock towards Rs 1,933 levels, which is also its 100-WMA. In order to clock a meaningful rally, the counter needs to decisively close above its 200-WMA, placed at Rs 2,300. A breakout above it may lead the stock towards Rs 2,700 levels.
CLICK HERE FOR THE CHART  "Bajaj Auto, TVS: How to trade two-wheeler stocks this festive season")


